
Article Categories
- All Categories
-
 Data Structure
-
 Networking
-
 RDBMS
RDBMS
-
 Operating System
-
 Java
Java
-
 MS Excel
-
 iOS
iOS
-
 HTML
HTML
-
 CSS
CSS
-
 Android
-
 Python
-
 C Programming
-
 C++
C++
-
 C#
C#
-
 MongoDB
-
 MySQL
MySQL
-
 Javascript
-
 PHP
PHP
-
 Economics & Finance
How to add a single data point in an Excel line chart?
Excel makes it simple to combine two data series into a single chart. Now, only one data point must be added to an existing Excel line chart.
Add a single data point in an excel line chart
Let?s understand step by step with an example.
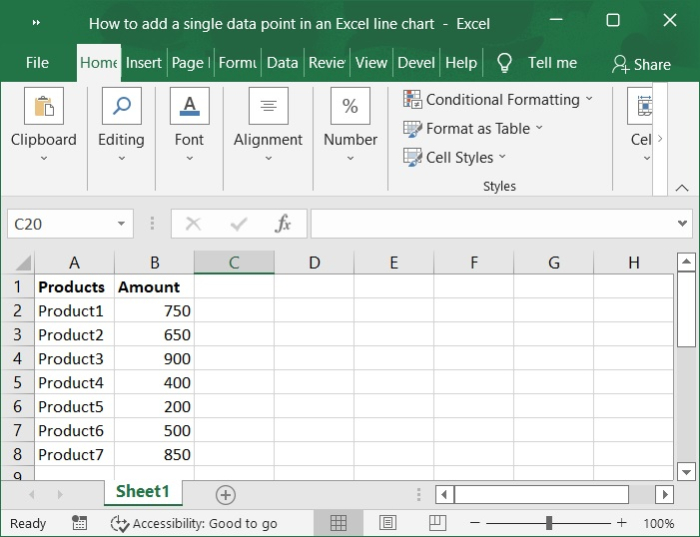
Step 1
In the first, we must create a sample data for chart in an excel sheet in columnar format as shown in the below screenshot.
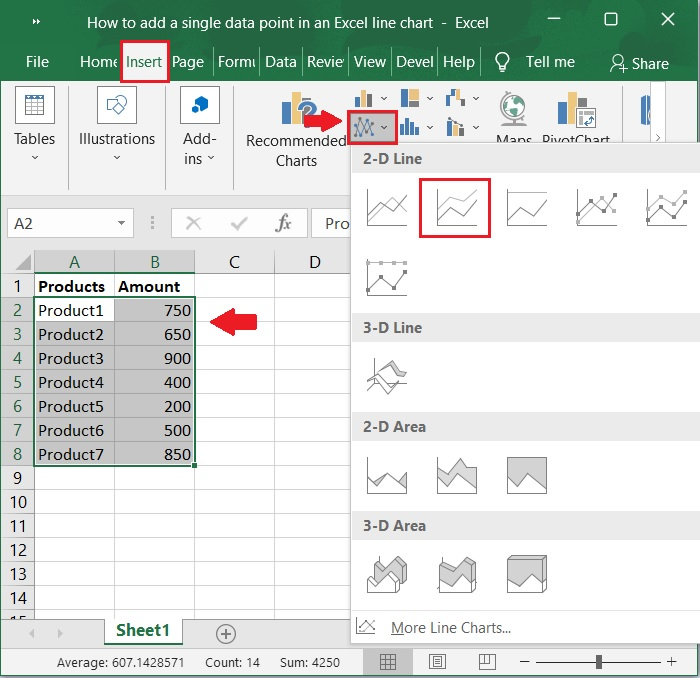
Step 2
Then, select the cells in the A2:B8 range. Click on Insert tool bar and select chart>Line>2-D Line to display the Line graph. Below is the screenshot for the same.
Step 3
Now, the chart is automatically populated upon selecting the above option. Refer to the below screenshot.

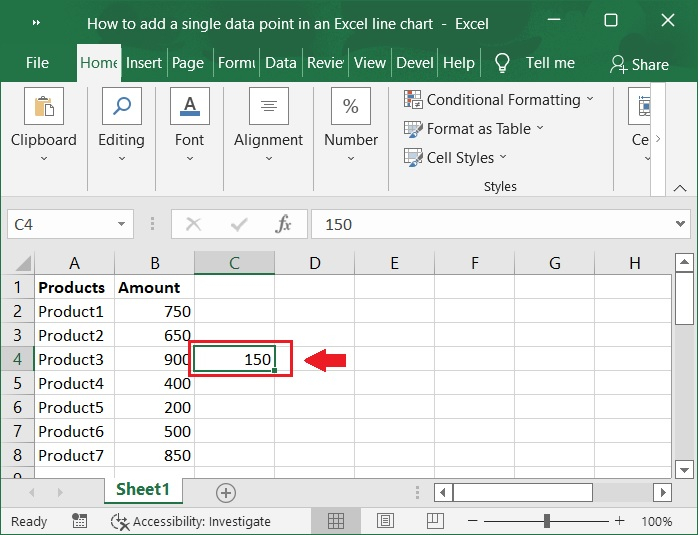
Step 4
Next to the source data, enter the data point to be added to the chart. See the below screenshot.
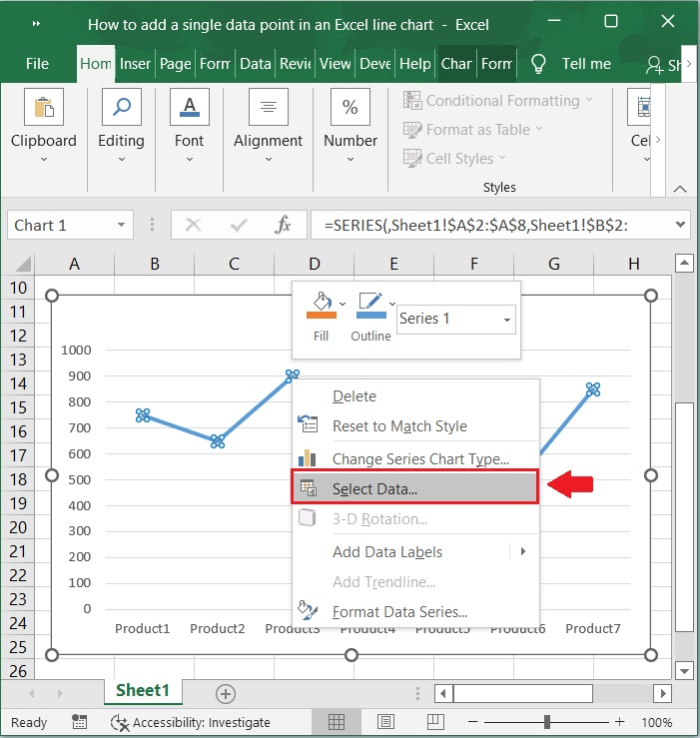
Step 5
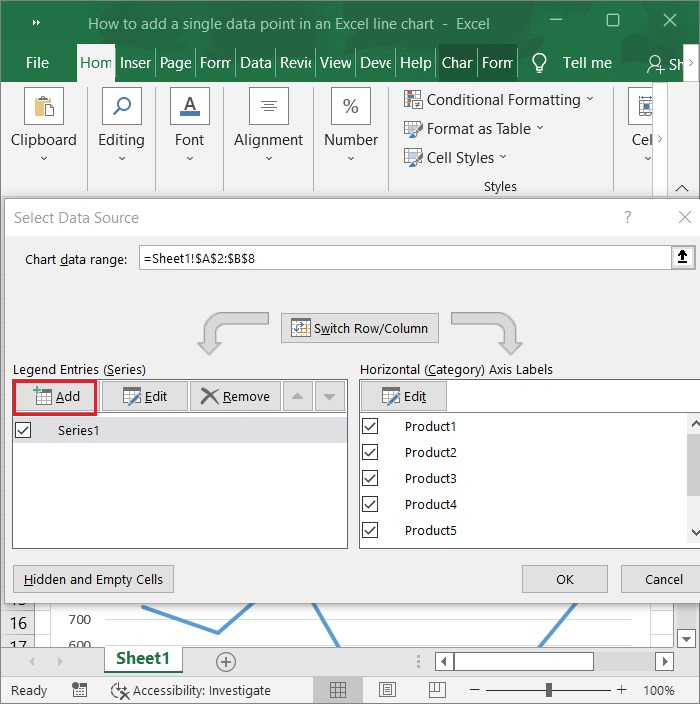
Now, Right-click the line chart and choose Select Data from the menu that comes up. As shown in the below screenshot.
Step 6
Please select the Add button in the Legend Entries (Series) section of the Select Data Source dialogue box. This will allow you to add entries to the legend. Refer to the below screenshot.
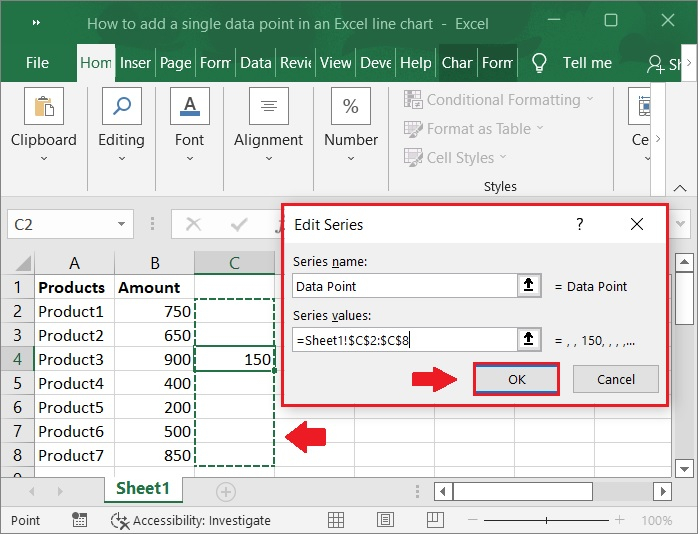
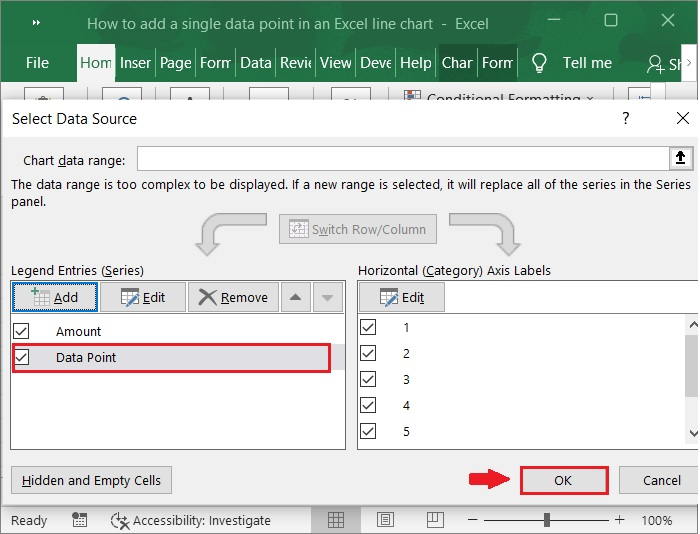
Step 7
The Edit Series dialogue box then appears. Enter any name in the data point Series name box, then choose the entire column, including the data point, as the Series values, and then click the OK button. exit both dialogue boxes. As shown in the below screenshot.
Step 8
Go ahead and choose Change Series Chart Type from the context menu by right-clicking the line in the graph.

Step 9
In the change chart type click line. see the below screenshot.
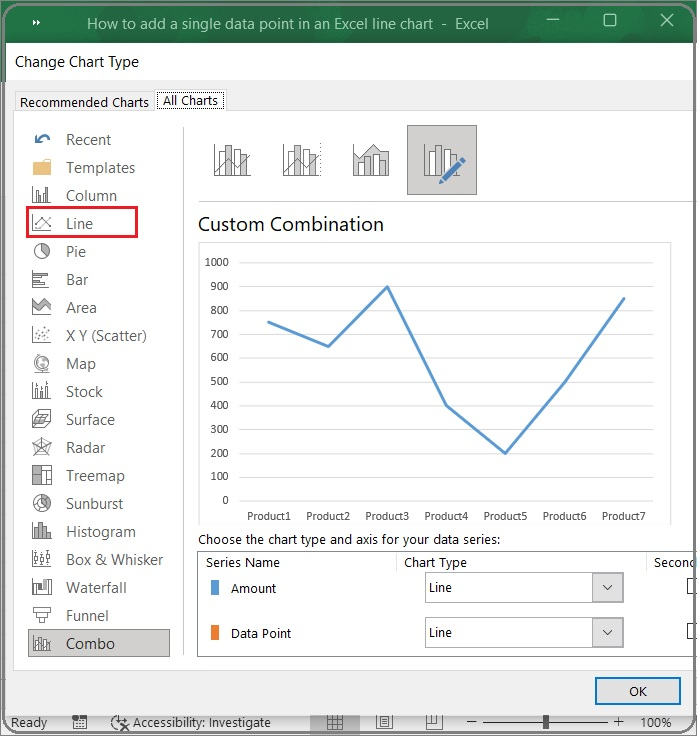
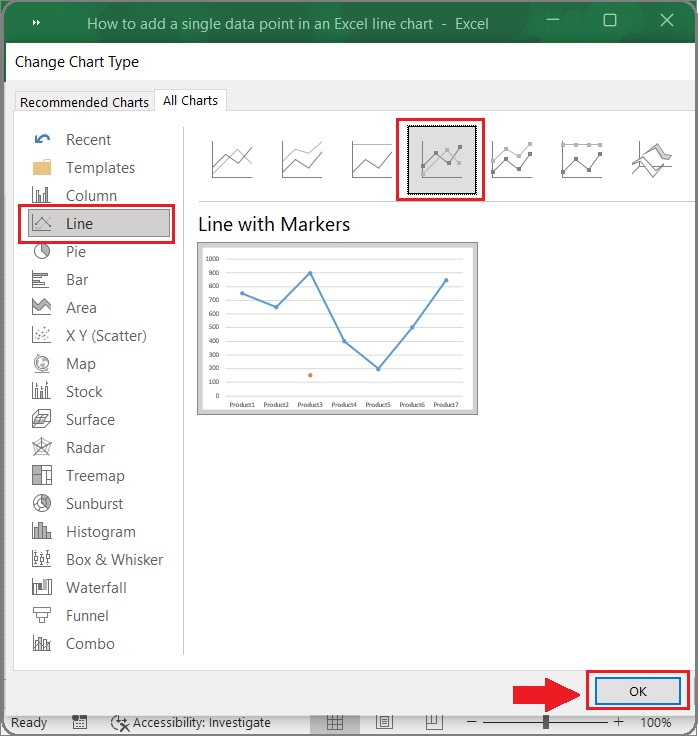
Step 10
Under the All-Charts tab, in the Change Chart Type dialogue box, click Line in the left bar, then Line with Markers, and then click OK.as shown in the below screenshot.
Step 11
You can now see that the line chart has a single data point. As shown in the below screenshot.

Conclusion
In this article, we learnt how to add a single data point in an excel line chart.

17K+ Views
