
 Data Structure
 Networking
 RDBMS
RDBMS Operating System
 Java
Java MS Excel
 iOS
iOS HTML
HTML CSS
CSS Android
 Python
 C Programming
 C++
C++ C#
C# MongoDB
 MySQL
MySQL Javascript
 PHP
PHP
- Selected Reading
- UPSC IAS Exams Notes
- Developer's Best Practices
- Questions and Answers
- Effective Resume Writing
- HR Interview Questions
- Computer Glossary
- Who is Who
How to add data labels from different columns in an Excel chart?
After you add data labels to a chart, the chart will immediately take up data labels from the data source of the current chart when you save your changes. On the other hand, there may be situations in which you need to add data labels from a column that is not the one you are currently using.
Add data labels from different column
Changing the data labels in a chart is a simple process. Choose a single data label to work with, and then in the formula bar, provide a reference to a cell. On the chart itself, you may also modify the data labels one at a time. When there are a lot of data labels, the work rapidly becomes laborious and time-consuming. However, hold on, there is a simpler answer that involves utilising a duplicate series on just a secondary axis.
Step 1
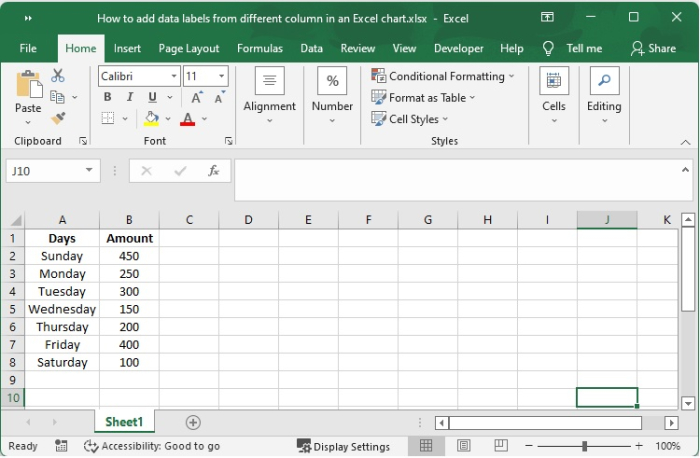
You are going to learn how to add drop line graph by looking at this little example. In order to get it done,
Step 2
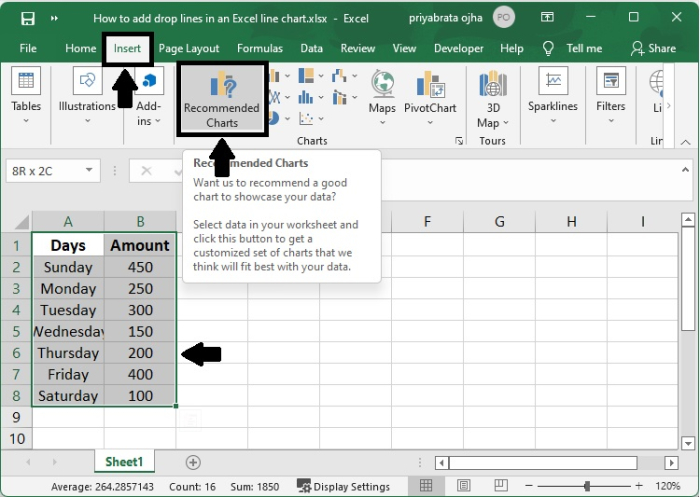
Choose all the data from the source, being sure to include the Amount column (A1:B8).
Click Recommended Charts by going to the Insert tab, that is found on the Charts group
Step 3
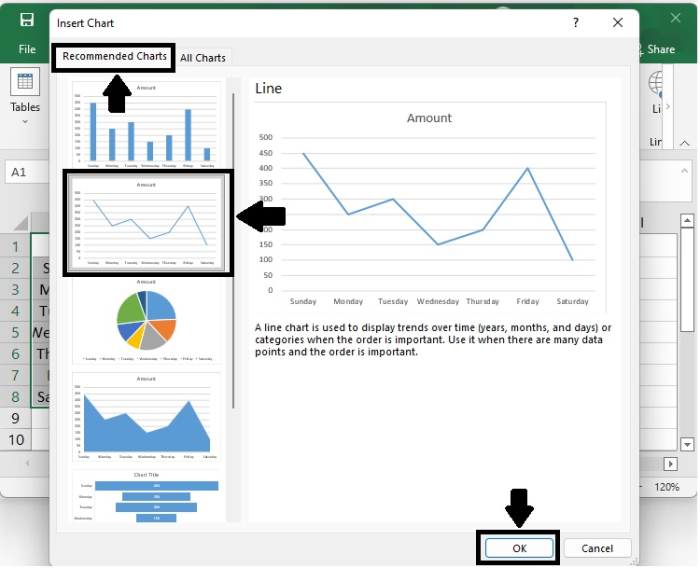
There is a popup that's been given the name insert chart. Choose from the recommended charts, then click on the line chart.
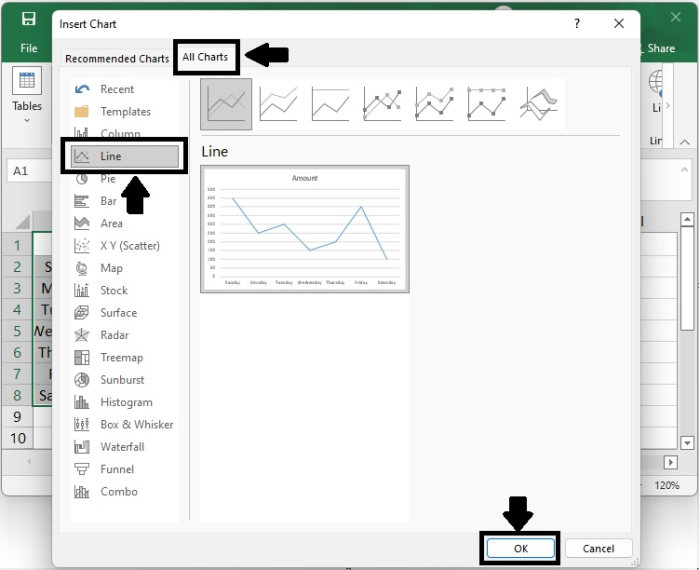
Or, click the All Charts tab, then choose the Clustered Column ? Line template, and then click the OK button.
Step 4
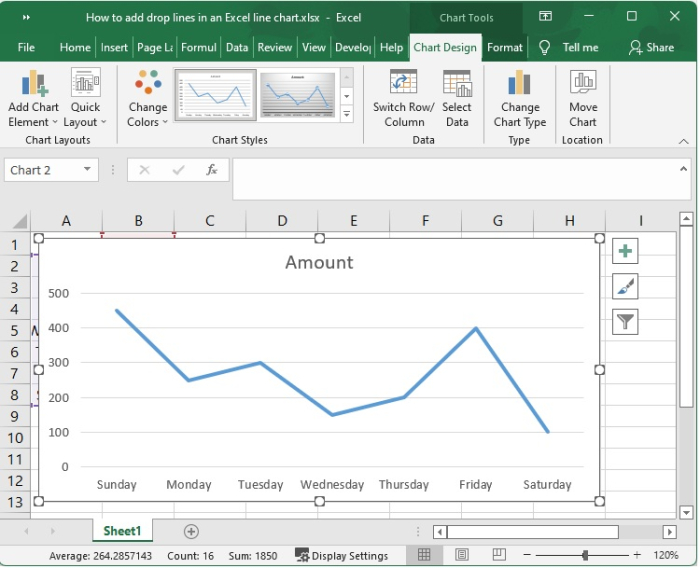
You have produced a line chart in Excel, as seen in the following snapshot.
Step 5
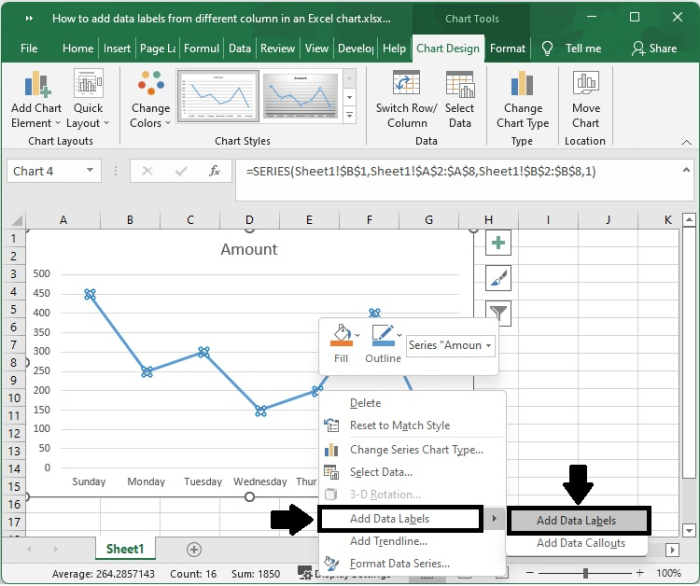
To add data labels, right-click the set of data in the chart, then pick the Add Data Labels option in Add Data Labels from the context menu. This will bring up a new window.
Step 6
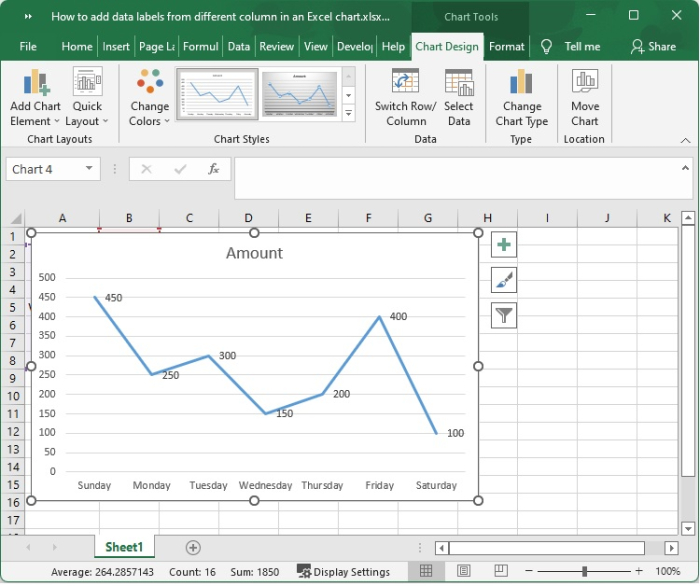
This is the data label that is currently shown in the chart.
Step 7
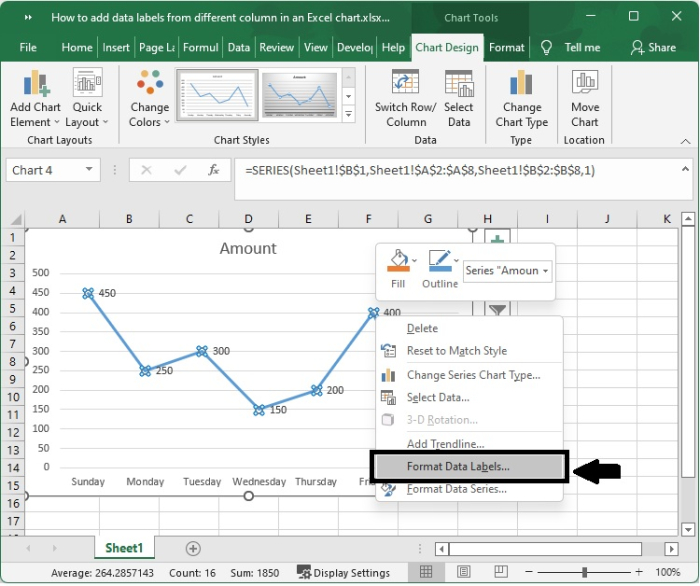
If you click any data label, then all data labels will be selected. If you click a specific data label, then just that data label will be selected on the chart.
Right-click on the line chart, then choose Format Data Labels from the menu that appears.
Step 8
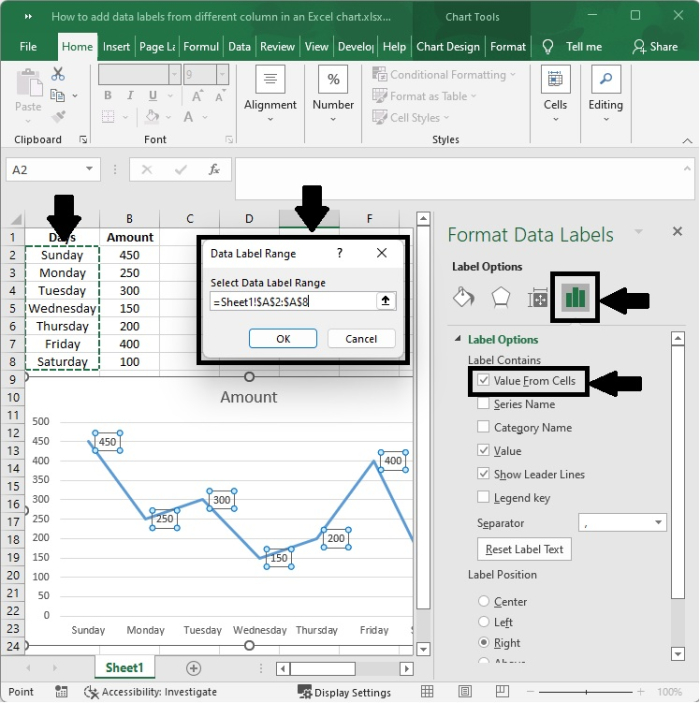
Within the Format Data Labels, locate the Label Options tab. Check the box next to the Value From Cells option. Then the new window that has shown, choose the appropriate column that shows labels, and then click the OK button.
Step 9
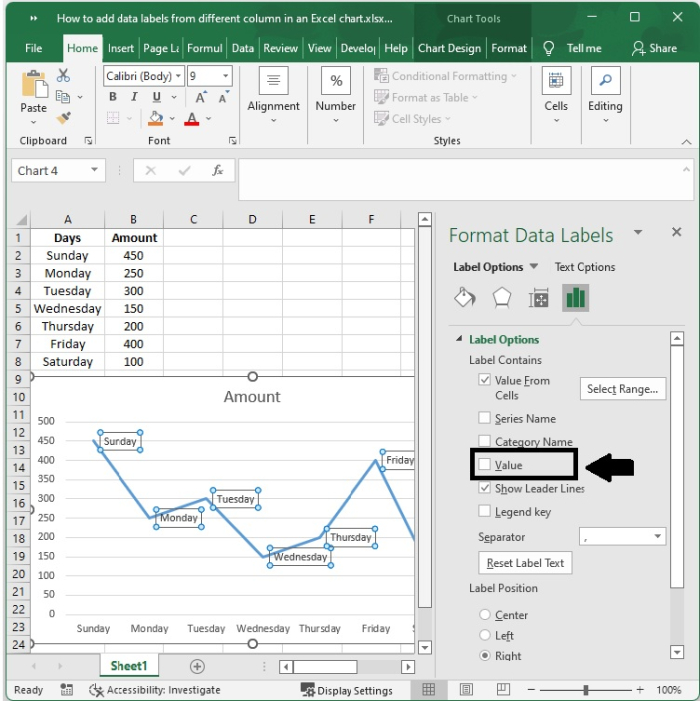
If you have the box next to the value choice checked, then you need to uncheck it.
Step 10
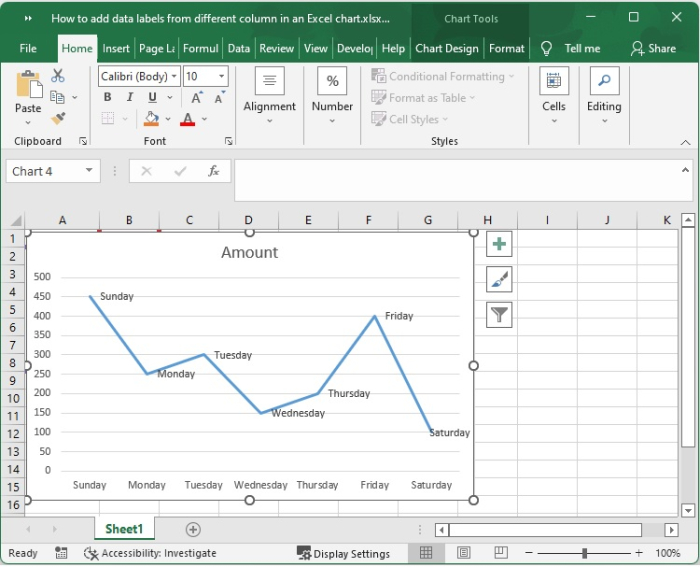
The original data labels are now appended after the cell values, which are done in bulk.
Conclusion
In this tutorial, we explained the steps that you can follow to add data labels from different columns in an Excel chart.

