
Article Categories
- All Categories
-
 Data Structure
-
 Networking
-
 RDBMS
RDBMS
-
 Operating System
-
 Java
Java
-
 MS Excel
-
 iOS
iOS
-
 HTML
HTML
-
 CSS
CSS
-
 Android
-
 Python
-
 C Programming
-
 C++
C++
-
 C#
C#
-
 MongoDB
-
 MySQL
MySQL
-
 Javascript
-
 PHP
PHP
-
 Economics & Finance
How to add moving average line in an Excel chart?
It may be difficult to determine the direction in which the data is trending when looking at a chart that has just been made in Excel. These visualisations can have thousands upon thousands of individual data points. In some cases, we can determine the direction in which the data is moving over time; however, in other cases, we must use various tools within Excel to figure out what is going on. The use of trend lines and moving average lines will help you achieve this goal
The use of trend lines is becoming increasingly commonplace when trying to determine the direction in which the data is going on a chart. When you follow the instructions below, Excel will automatically calculate and draw these lines for you, saving you time in the process.
Create a Line that Represents the Moving Average
You are going to learn how to add moving average to a line graph by looking at this little example.
Step 1
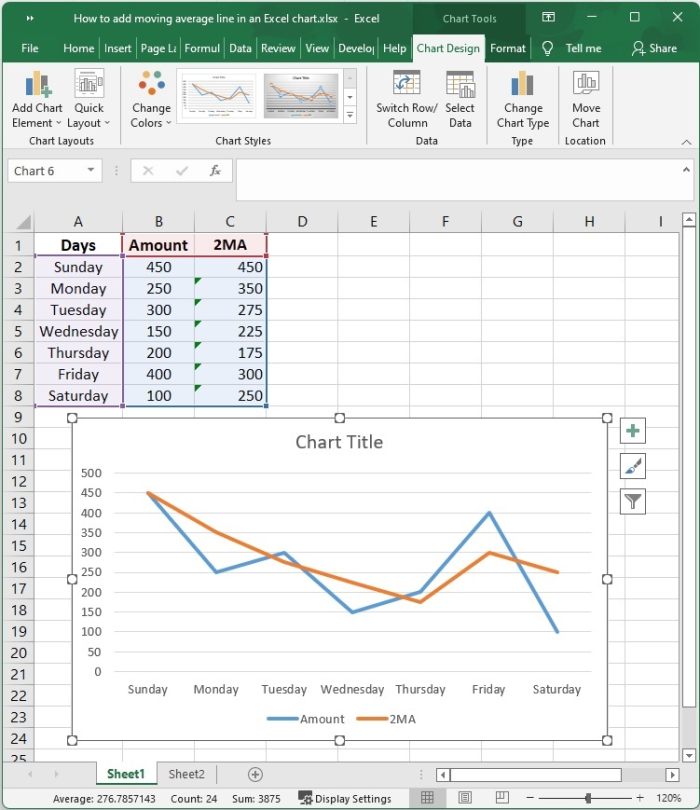
In order to add a moving average to a line graph, open an Excel sheet and feed some sample data, as shown in the following graph.

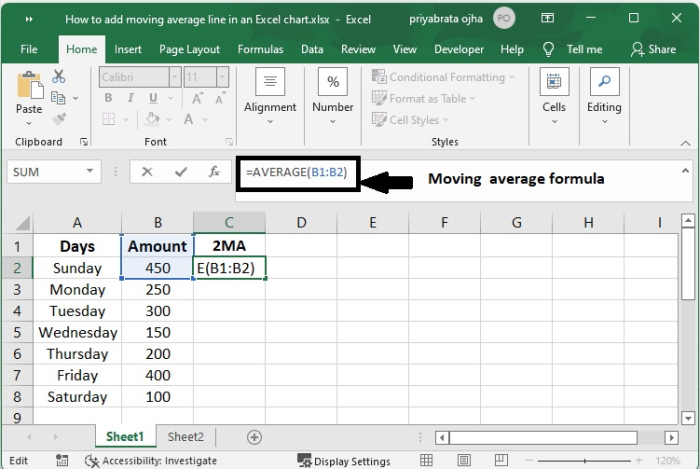
Step 2
Utilize the AVERAGE function in order to do the calculation for the moving average. In this instance, you should start by entering the formula shown below in cell C2 .
=AVERAGE(B1:B2)
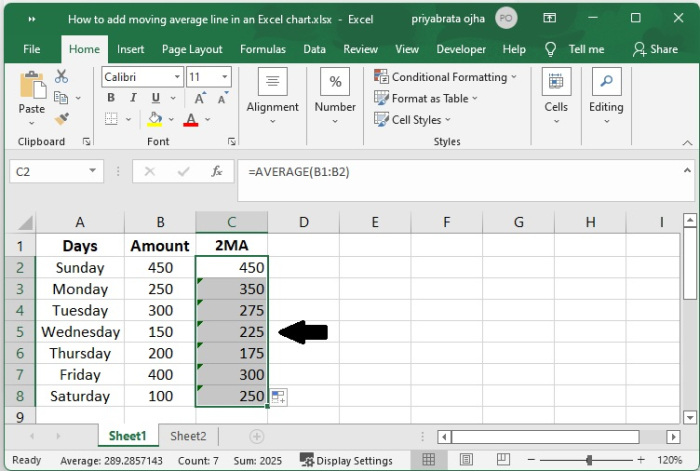
Step 3
Then, go on with the process of replicating it down the column.
Step 4
Choose the data from the source, being sure to include the Average column (A1:C8).
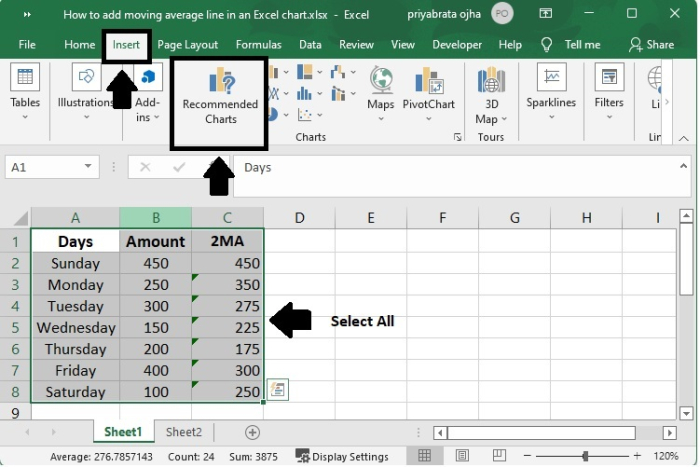
Step 5
Click "Recommended Charts" by going to the Insert tab, then clicking on the Charts group.
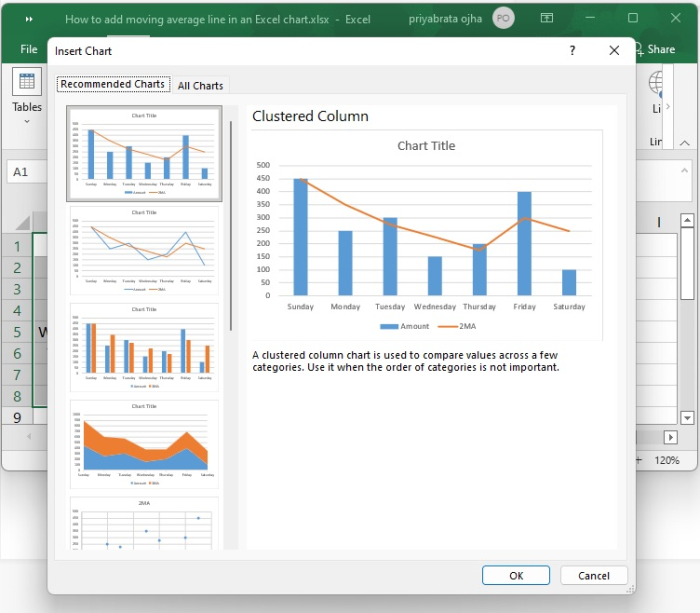
Step 6
Click the All Charts tab, then choose the Clustered Column - Line template, and then click the OK button.
If none of the standard combination charts meet your requirements, you may pick the Custom Combination type (the final template with the pen icon), and then choose the appropriate type for each of the data series.
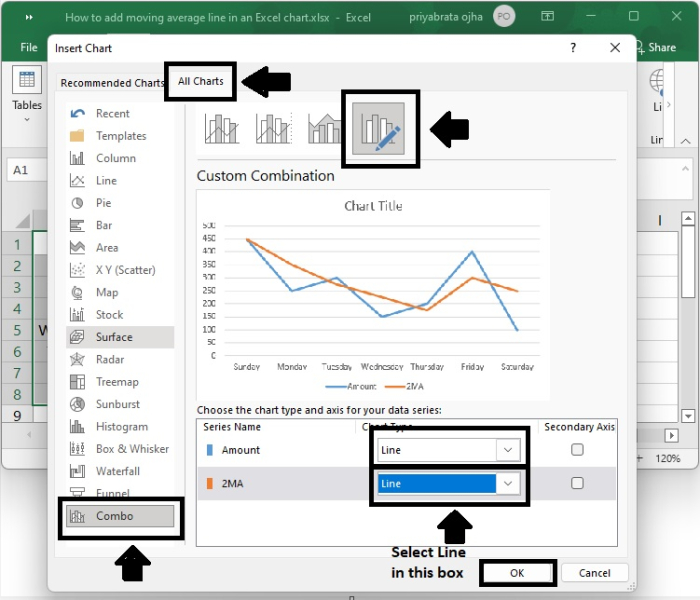
Step 7
In a line graph, you can create a line that represents the average. The procedures are exactly the same, with the exception that you must choose either the Line or the Line with Markers type for the Actual data series:
Conclusion
In this tutorial, we demonstrated how you can add a moving average line in an Excel file and how to customize it.

817 Views
