
Article Categories
- All Categories
-
 Data Structure
-
 Networking
-
 RDBMS
RDBMS
-
 Operating System
-
 Java
Java
-
 MS Excel
-
 iOS
iOS
-
 HTML
HTML
-
 CSS
CSS
-
 Android
-
 Python
-
 C Programming
-
 C++
C++
-
 C#
C#
-
 MongoDB
-
 MySQL
MySQL
-
 Javascript
-
 PHP
PHP
-
 Economics & Finance
How to Extract Data from Chart or Graph in Excel
Visual data representations, such charts and graphs, offer a useful approach to comprehend and analyse data. To obtain the underlying data points from a chart or graph, however, may be necessary in some circumstances for reporting or additional analysis. Whether you work with data as a researcher, student, data analyst, or in any other capacity, this course will provide you the knowledge and abilities you need to get the most out of Excel's visual representations.
You will have a thorough understanding of how to extract data from charts and graphs by the end of this tutorial, enabling you to uncover hidden insights and base decisions on the data. Make sure you have a fundamental understanding of Excel and its features before we begin exploring the various techniques. Understanding how to create charts and graphs in Excel would also be useful. So let's get going and discover the potential of data extraction from Excel's graphs and charts!
Extracting Data from Chart or Graph
Here, we will first create a VBA module and then run it to complete the task. So let us see a simple process to learn how you can extract data from a chart or graph in Excel.
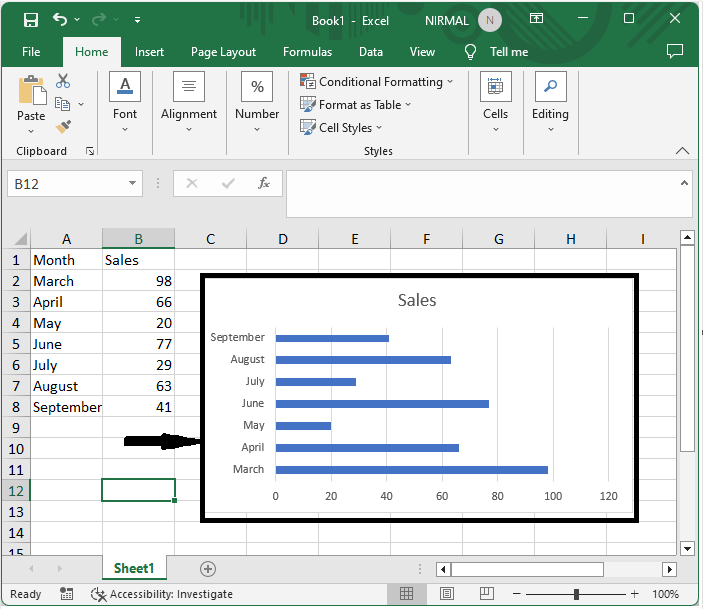
Step 1 : Consider an Excel sheet where you have a chart similar to the below image.
First, use Alt + F11 to open the VBA application.
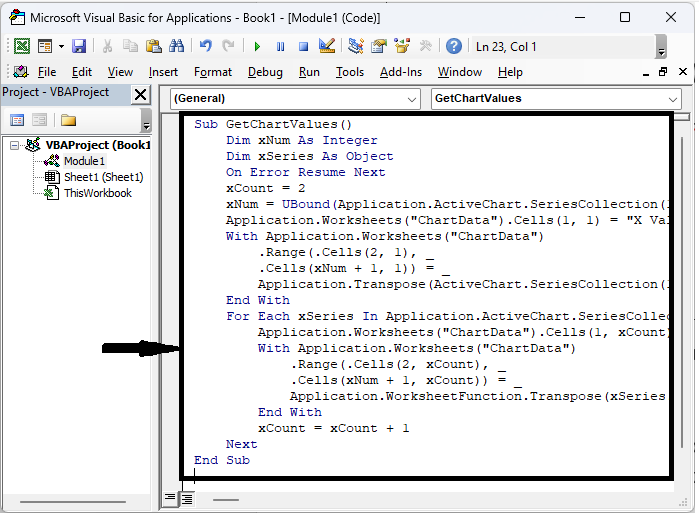
Step 2 : Then click on Insert, select Module, and copy the below code into the text box.
Insert > Module > Copy.
Example
Sub GetChartValues()
    Dim xNum As Integer
    Dim xSeries As Object
    On Error Resume Next
    xCount = 2
    xNum = UBound(Application.ActiveChart.SeriesCollection(1).Values)
    Application.Worksheets("ChartData").Cells(1, 1) = "X Values"
    With Application.Worksheets("ChartData")
        .Range(.Cells(2, 1), _
        .Cells(xNum + 1, 1)) = _
        Application.Transpose(ActiveChart.SeriesCollection(1).XValues)
    End With
    For Each xSeries In Application.ActiveChart.SeriesCollection
        Application.Worksheets("ChartData").Cells(1, xCount) = xSeries.Name
        With Application.Worksheets("ChartData")
            .Range(.Cells(2, xCount), _
            .Cells(xNum + 1, xCount)) = _
            Application.WorksheetFunction.Transpose(xSeries.Values)
        End With
        xCount = xCount + 1
    Next
End Sub
Step 3 : Then save the sheet as a macro?enabled template and click F5 to run the module. Then you can see that the data will be extracted from the chart.
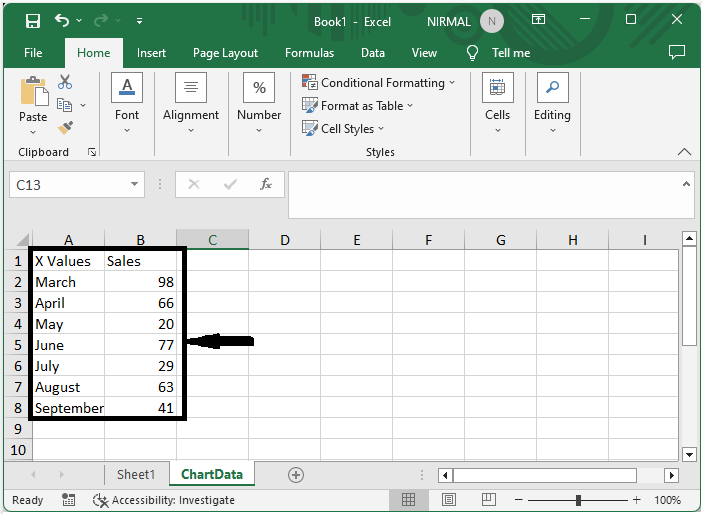
Note: You must have a sheet named ChartData in the workbook in order to use the code.
Conclusion
In this tutorial, we have used a simple example to demonstrate how you can extract data from a chart or graph in Excel to highlight a particular set of data.

6K+ Views
