
Article Categories
- All Categories
-
 Data Structure
-
 Networking
-
 RDBMS
RDBMS
-
 Operating System
-
 Java
Java
-
 MS Excel
-
 iOS
iOS
-
 HTML
HTML
-
 CSS
CSS
-
 Android
-
 Python
-
 C Programming
-
 C++
C++
-
 C#
C#
-
 MongoDB
-
 MySQL
MySQL
-
 Javascript
-
 PHP
PHP
-
 Economics & Finance
How to Add Total Labels to a Stacked Column Chart in Excel?
A stacked column chart in Excel is a basic chart that allows part-to-whole comparisons at one time. In this type of chart, the data labels are kept on top of each other to form a single bar for each graph data variable. A stacked column chart helps to understand the graph over time because it is easy to compare total colour length. In this tutorial, let's look at a quick way to add the total data label to a stacked column chart.
Adding Total Labels to a Stacked Column Chart in Excel
Here we will first create the stacked column chart, then change its format, and finally add the data labels from the right-click menu. Let's take a look at a simple procedure for adding total labels to a stacked column chart in Excel.
Step 1
Consider the following Excel sheet with data similar to the image below.
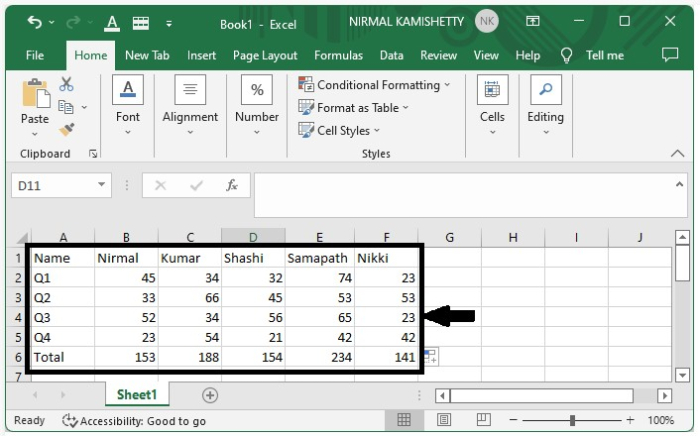
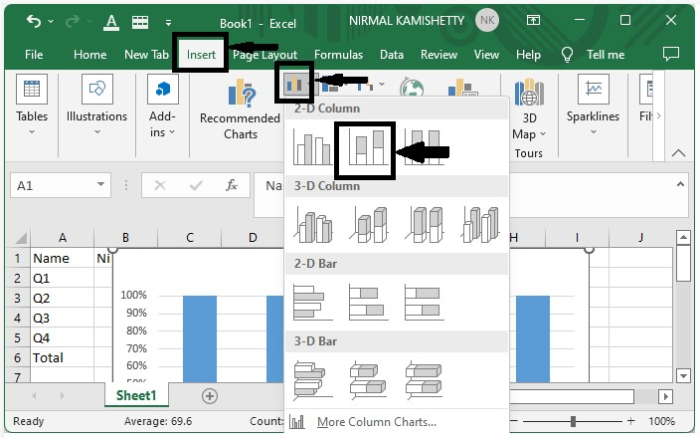
To create a 2D column, select 2D column from the graph section under the insert menu after selecting the data.
Select data > Insert > 2D Column
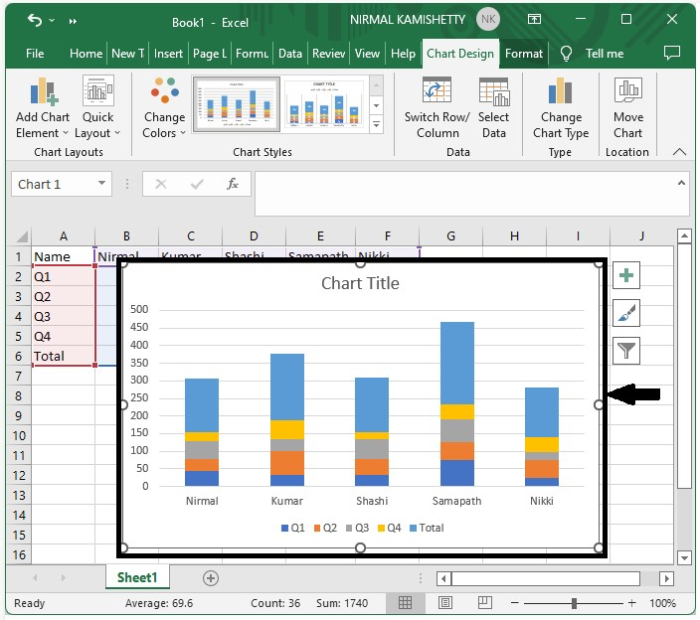
The stacked graph will look like the below image ?
Step 2
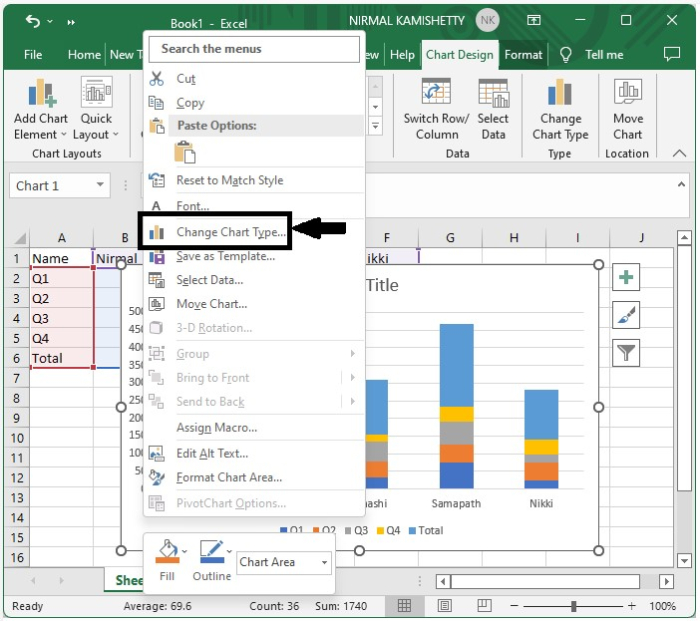
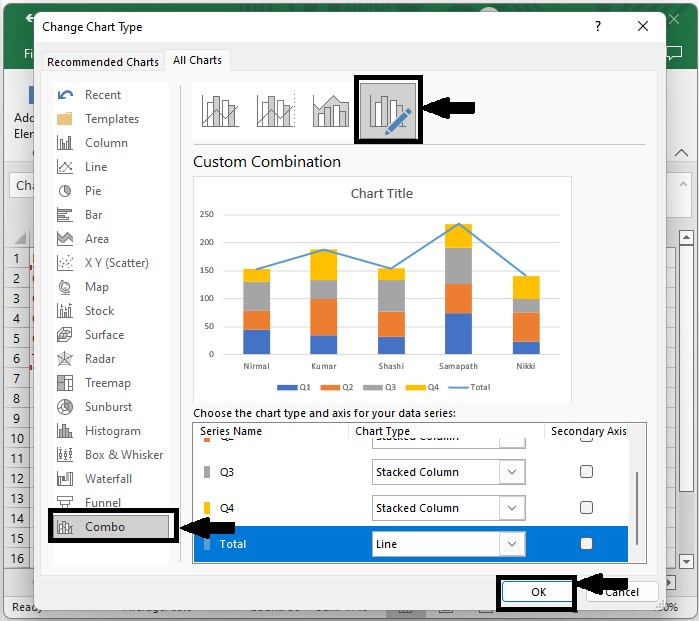
Now, right-click on the chart area and select Change Chart Type from the menu box.
A pop-up menu will be shown. select the combo from the left drop-down list, select customize, and set all the types except total to stacked column and total to line as shown in the below image.
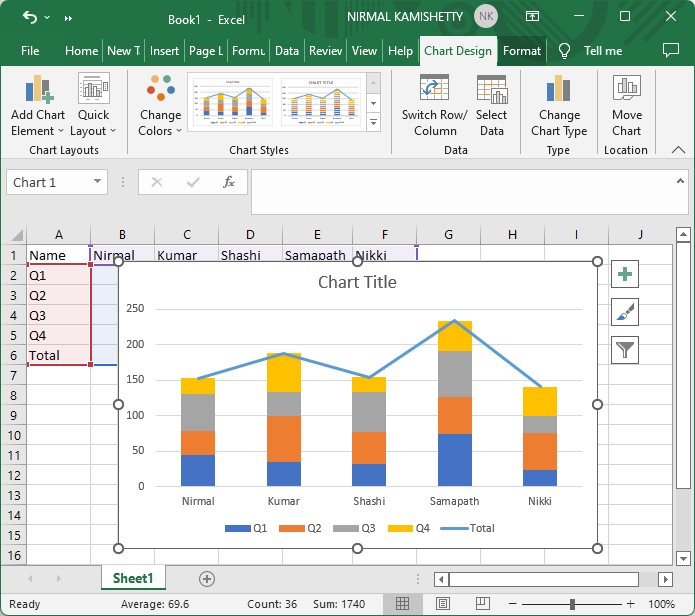
Then the graph will be transformed as shown in the below screenshot.
Step 3
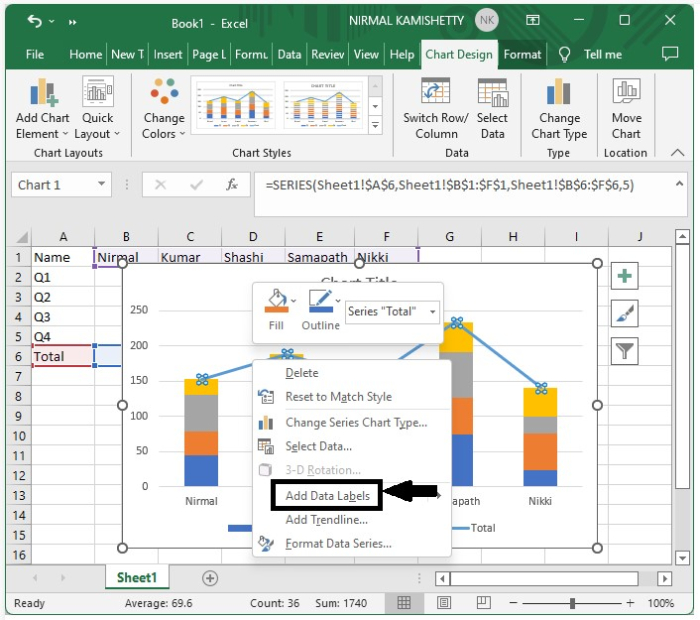
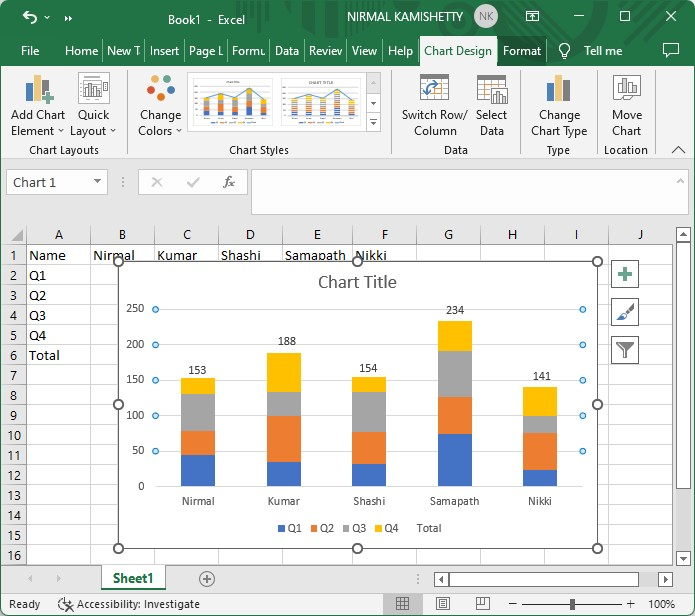
Now, right-click on the new line and select Add data labels from the menu box.
The data labels will be successfully shown and adjusted, placing them correctly above each bar as shown in the below image.
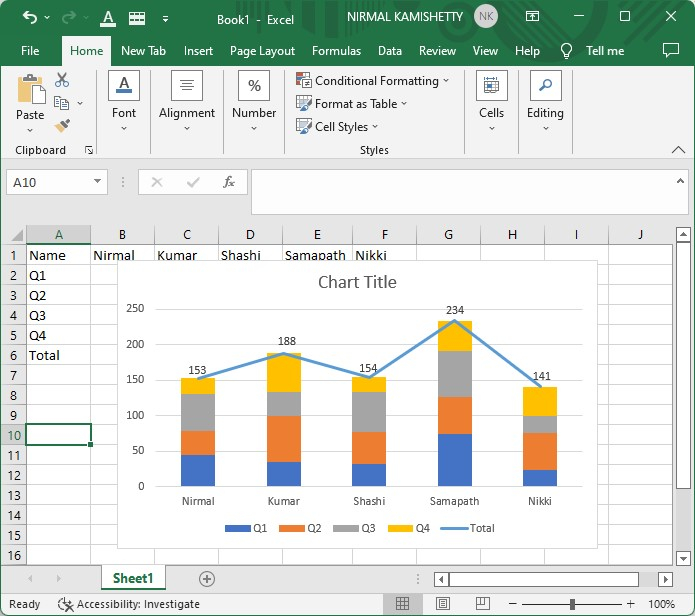
We have successfully added the data labels; now we need to remove the line.
Step 4
To remove the line once again, right-click on any bar and select format data series to get the format menu.
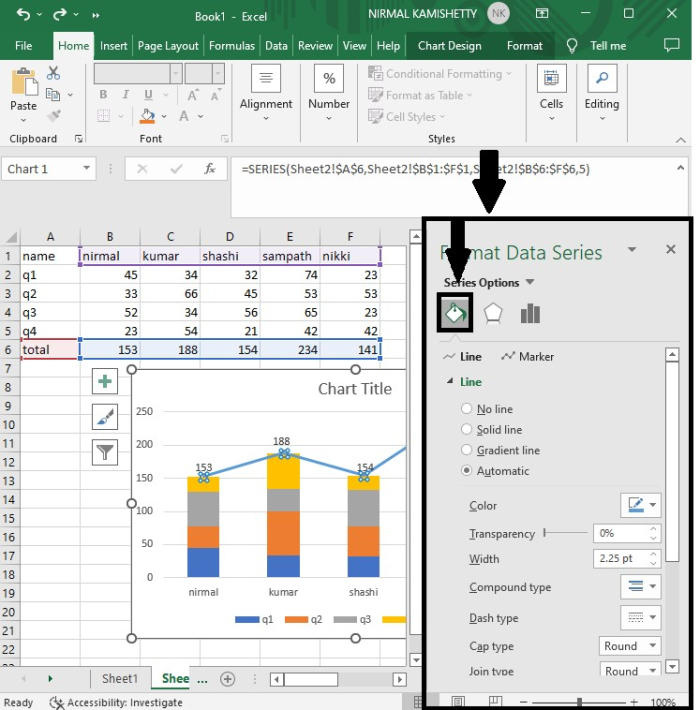
Step 5
Select no line from the line menu, and our line will be successfully removed, and our final output will be generated, as shown in the screenshot below.
Conclusion
In this tutorial, we used a simple example to demonstrate how we can add a total data label to the stacked column graph in Excel to highlight a particular set of data.

8K+ Views
