- Geography India - Introduction
- Geography India - Physical Aspect
- Geography India - Drainage System
- Geography India - Climate
- Geography India - Natural Vegetation
- Geography India - National Forest
- Geography India - Wildlife
- Geography India - Soil
- Geography India - Land Resources
- Geography India - Agriculture
- Geography India - Mineral Resources
- Geography India - Energy Resources
- Geography India - Industry
- Geography India - Transport
- Geography India - Communication
- Geography India - Foreign Trade
- Geography India - The People
- Geography India - Settlement
- Geography India - Migration
- Regional Development
- Geography India - Disasters
- Geography of the World
- Geography World - Introduction
- Evolution of the Earth
- Geography World - Climate
- Geography World - Transport
- Geography World - Communications
- Geography World - Population
- Human Settlement
- Human Development
- International Trade
- Geography Useful Resources
- Geography - Online Quiz
- Geography - Online Test
- Geography - Quick Guide
- Geography - Useful Resources
- Geography - Discussion
Geography World - Population
Introduction
Roughly, 90 per cent of the world population lives in about 10 per cent of its land area.
The 10 most populous countries of the world contribute about 60 per cent to the worlds population.

Out of the top ten most populous countries, 6 are located in Asia.
China is the most populous country of the world followed by India, the USA, Indonesia, Brazil, Pakistan, Bangladesh, Nigeria, Russian Federation, and Japan.
The ratio between the number of people to the size of land is known as the density of population.
The density of Population is usually measured in persons per sq. km.
Factors Influencing Population Distribution
Major factors that influence the distribution of population (i.e. density of population) are −
Availability of water
Landforms
Climate
Soils
Availability of mineral resources
Urbanization
Industrialization
Social & Cultural factors
Change in Population
The change in the number of inhabitants of a given territory during a specific period of time; this change may be either positive or negative.
The positive change in population is known as population growth.
Natural Population Growth is the increased population, which is calculated by deducting total numbers of deaths from the total number of births in a particular region between two points of time.
The actual growth of population is calculated as −
Births − Deaths + In Migration − Out Migration.
Births, deaths, and migration are the three components of population change.
The Crude Birth Rate (CBR) is expressed as number of live births in a year per thousand of the population.
Crude Death Rate (CDR) is expressed in terms of deaths in a particular year per thousand of population in a particular region.
Migration
When people move from one place to another, the place they move from is called the Place of Origin and the place they move to is known as the Place of Destination.
Migration may be permanent, temporary, or seasonal.
Migrants who move into a new place are known as Immigrants.
Migrants who move out of a place are known as Emigrants.
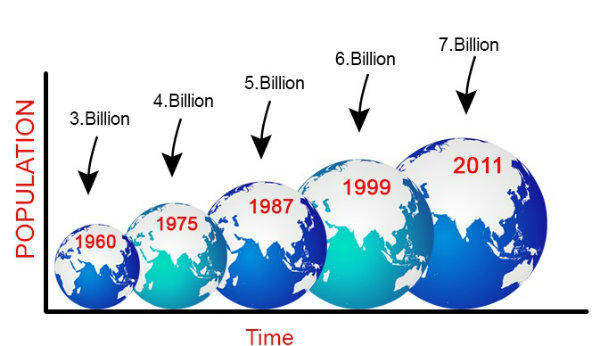
Population Growth
First time one billion population, world attains in 1830, the second billion population after 100 years (i.e. in 1930), the third billion population after 30 years (i.e. in 1960), the fourth billion population after 15 years (i.e. in1975), the fifth billion population after 12 years (i.e. in 1987), the sixth billion population after 12 years (i.e. in 1999), and the seven billion population again after 12 years (i.e. in 2011).
Industrial revolution along with fast technological advancement helped in the reduction of death rate and provided a stage for accelerated population growth.
Normally, developed countries take more time to increase their population than developing countries.
Many of the African countries growth rate is much higher; annual population growth rate even more than 4%.
On the other hand, many countries of the Eastern Europe including Russia, Latvia, Estonia, Germany, Portugal, Italy, etc. have negative population growth rate.
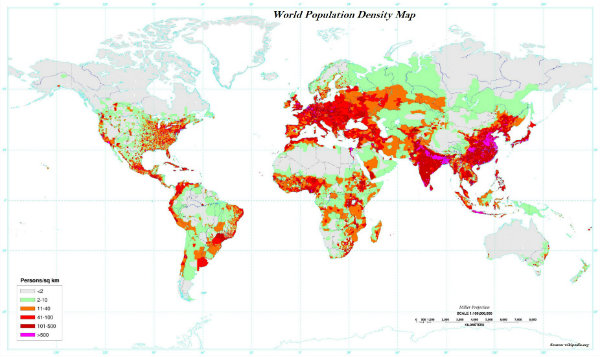
The following map shows the population density of the world population −
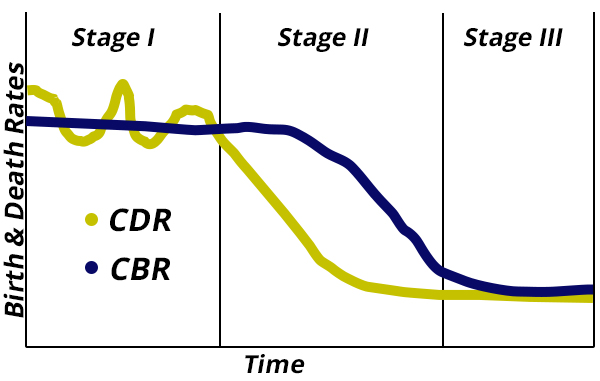
Demographic Transition Theory
Demographic transition theory describes population change of a given region; further, it explains that population changes from high births and high deaths to low births and low deaths, as the society progresses from rural, agrarian and illiterate to urban, industrial and literate society.
Demographic transition theory is explained in three stages as −
Stage I
The first stage is the period of high fertility and high mortality, so most likely no population change or very low population growth.
In the first stage, people are largely engaged in agriculture (primary sector).
Further, in the first stage, life expectancy used to be low and people are mostly illiterate and have low levels of technology.
Stage II
In the second stage, initially, fertility remains high, but over the period of time, it starts declining. On the other hand, mortality rate gets reduced because of the improvements in sanitation and health condition; likewise, population growth rate increases.
Stage III
In the last stage, both the fertility and the mortality decline considerably; resultantly, the population is either stable or grows slowly (as shown in the graph given above).
In the last or III stage, the population becomes urbanized, literate, and has high technical knowhow and deliberately controls the family size.
In 1793, Thomas Malthus propounded a theory and stated that the number of people would increase faster than the food supply.
Population Composition
The ratio between the number of women and men in the population is known as the Sex Ratio.
The sex ratio is an important indicator about the status of women in a country.
Females have a biological advantage over males because they are more resilient than males.
The world population illustrates a sex ratio of 102 males per 100 females.
With record 85 males per 100 females, Latvia has the highest sex ratio in the world; on the other hand, in Qatar, there are 311 males per 100 females.
The sex ratio is favorable for females in (about) 139 countries of the world and unfavorable in rest of the countries.
Asia has a low sex ratio. For example, countries like China, India, Saudi Arabia, Pakistan, and Afghanistan have a lower sex ratio.
On the other hand, many parts of Europe have greater sex ratio; probably because of better status of women in society and large number of males migrating to different parts of the world (in the past).
Age structure of a country is an important indicator of population composition that represents the number of people of different age groups.
The age group of 15-59 indicates a large number of working population; the most productive age group.
On the other hand, a greater proportion of population above 60 years represents an ageing population and they require more expenditure on health care facilities.
Similarly, high proportion of young population of a country means − the country has high birth rate and the population is youthful.
The age-sex structure of a population refers to the number of females and males in different age groups.
Population Pyramid
A population pyramid is used to study the age-sex structure of the population.
The shape of the population pyramid illustrates the characteristics of the population.
The following image illustrates the different shapes of pyramid that shows different compositions −
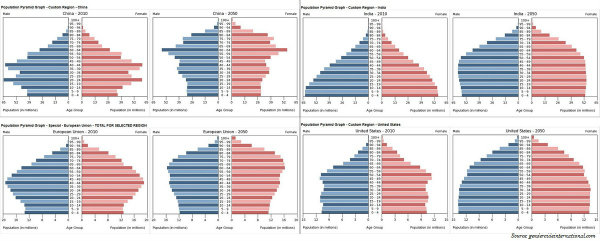
The left side illustrates the percentage of males; on the other hand, the right side shows the percentage of women in each age group.
In Western countries, males outnumber females in rural areas and females outnumber the males in urban areas. On the other hand, the countries like Nepal, Pakistan, and India have reverse case.
