- DBMS - Home
- DBMS - Overview
- DBMS - Architecture
- DBMS - Data Models
- DBMS - Data Schemas
- DBMS - Data Independence
- DBMS - System Environment
- Centralized and Client/Server Architecture
- DBMS - Classification
- Relational Model
- DBMS - Codd's Rules
- DBMS - Relational Data Model
- DBMS - Relational Model Constraints
- DBMS - Relational Database Schemas
- DBMS - Handling Constraint Violations
- Entity Relationship Model
- DBMS - ER Model Basic Concepts
- DBMS - ER Diagram Representation
- Relationship Types and Relationship Sets
- DBMS - Weak Entity Types
- DBMS - Generalization, Aggregation
- DBMS - Drawing an ER Diagram
- DBMS - Enhanced ER Model
- Subclass, Superclass and Inheritance in EER
- Specialization and Generalization in Extended ER Model
- Data Abstraction and Knowledge Representation
- Relational Algebra
- DBMS - Relational Algebra
- Unary Relational Operation
- Set Theory Operations
- DBMS - Database Joins
- DBMS - Division Operation
- DBMS - ER to Relational Model
- Examples of Query in Relational Algebra
- Relational Calculus
- Tuple Relational Calculus
- Domain Relational Calculus
- Relational Database Design
- DBMS - Functional Dependency
- DBMS - Inference Rules
- DBMS - Minimal Cover
- Equivalence of Functional Dependency
- Finding Attribute Closure and Candidate Keys
- Relational Database Design
- DBMS - Keys
- Super keys and candidate keys
- DBMS - Foreign Key
- Finding Candidate Keys
- Normalization in Database Designing
- Database Normalization
- First Normal Form
- Second Normal Form
- Third Normal Form
- Boyce Codd Normal Form
- Difference Between 4NF and 5NF
- Structured Query Language
- Types of Languages in SQL
- Querying in SQL
- CRUD Operations in SQL
- Aggregation Function in SQL
- Join and Subquery in SQL
- Views in SQL
- Trigger and Schema Modification
- Storage and File Structure
- DBMS - Storage System
- DBMS - File Structure
- DBMS - Secondary Storage Devices
- DBMS - Buffer and Disk Blocks
- DBMS - Placing File Records on Disk
- DBMS - Ordered and Unordered Records
- Indexing and Hashing
- DBMS - Indexing
- DBMS - Single-Level Ordered Indexing
- DBMS - Multi-level Indexing
- Dynamic B- Tree and B+ Tree
- DBMS - Hashing
- Query Processing and Optimization
- Heuristics in Query Processing
- Transaction and Concurrency
- DBMS - Transaction
- DBMS - Scheduling Transactions
- DBMS - Testing Serializability
- DBMS - Conflict Serializability
- DBMS - View Serializability
- DBMS - Concurrency Control
- DBMS - Lock Based Protocol
- DBMS - Timestamping based Protocol
- DBMS - Phantom Read Problem
- DBMS - Dirty Read Problem
- DBMS - Thomas Write Rule
- DBMS - Deadlock
- Backup and Recovery
- DBMS - Data Backup
- DBMS - Data Recovery
- DBMS Useful Resources
- DBMS - Quick Guide
- DBMS - Useful Resources
- DBMS - Discussion
DBMS - Drawing an ER Diagram
Designing a database becomes easier when we use a graphical representation of the entire database. One of the best tools for this is the Entity-Relationship Diagram (ERD). It helps capture important details about entities, their relationships, and any constraints within a business environment.
In this chapter, we’ll learn how to design an ERD using a real-world example of a COMPANY database. We'll break down each step, explain the types of entities and relationships, and make the process easy to understand.
Company Database Tables Design
We have the following tables in the COMPANY database −
EMPLOYEE
| Fname | Minit | Lname | Ssn | Bdate | Address | Sex | Salary | Super_ssn | Dno |
DEPARTMENT
| Dname | Dnumber | Mgr_ssn | Mgr_start_date |
DEPT_LOCATIONS
| Dnumber | Dlocation |
PROJECT
| Pname | Pnumber | Plocation | Dnum |
WORKS_ON
| Essn | Pno | Hours |
DEPENDENT
| Essn | Dependent_name | Sex | Bdate | Relationship |
Basics of ER Diagram
To understand the example. Let us see the foundational concepts of an ERD: There are several components.
- Entities: Represent objects or items within a system, such as EMPLOYEE, DEPARTMENT, and PROJECT.
- Attributes: Characteristics that define an entity. For example, an EMPLOYEE may have attributes like Name, Ssn, Address, and Salary.
- Relationships: Connect entities and signify how they interact. For example, an EMPLOYEE may WORKS_FOR a DEPARTMENT.
Visual Representation in ER Diagrams
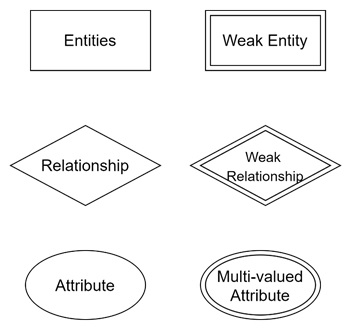
We use the following shapes for visual representation in ER diagrams −
- Rectangles for entities
- Diamonds for relationships
- Ovals for attributes
- Double ovals for multivalued attributes
- Double Rectangle: Weak Entity
- Double Diamond: Weak Relationship
Real-World Example: COMPANY Database ER Diagram
The COMPANY database shows a complex business structure. Here is how we create an ERD for it, incorporating key entities and relationships:
Identifying the Core Entities
The main entities in the COMPANY database are highlighted below −
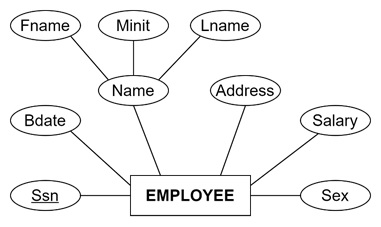
EMPLOYEE − Represents staff members with attributes such as Name, Ssn, Salary, and Bdate.
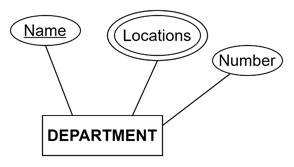
DEPARTMENT − The organizational unit with attributes like Name and Number.
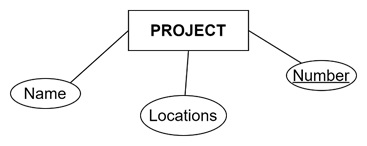
PROJECT − Tasks managed by departments with attributes including Name and Number.
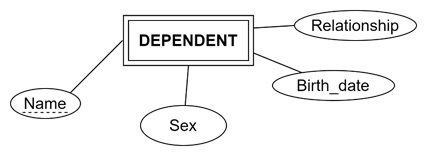
DEPENDENT − Individuals dependent on an employee with attributes like Name, Relationship, and Birth_date.
Defining the Key Relationships
Here are the main relationships connecting these entities:
- MANAGES − A relationship between EMPLOYEE and DEPARTMENT. Each department has one manager, but an employee may or may not manage a department.
- WORKS_FOR − A relationship between DEPARTMENT and EMPLOYEE. Each department has many employees, and each employee must be assigned to a department.
- CONTROLS − A relationship where a DEPARTMENT oversees one or more PROJECTS. A project is always managed by one department.
- SUPERVISION − A relationship where one EMPLOYEE supervises others.
- WORKS_ON − A relationship, showing that employees can work on multiple projects and vice versa. The Hours attribute is linked here to indicate time spent.
- DEPENDENTS_OF − A relationship between EMPLOYEE and DEPENDENT, highlighting that an employee may have one or more dependents.
Structuring the ER Diagram
Let us now understand the step-by-step process of creating the ER diagram:
- Draw the Entities − Create rectangles labelled EMPLOYEE, DEPARTMENT, PROJECT, and DEPENDENT. Connect ovals with key attributes like Name, Ssn, and Salary to the EMPLOYEE. Link attributes like Number to DEPARTMENT. We have seen the entity in the previous figures.
- Define the Relationships − Use diamonds to represent relationships like WORKS_FOR, MANAGES, etc. Connect these diamonds to relevant entities using straight lines. Use single lines for partial participation and double lines for total participation.
Example Breakdown: The following figure depicts the COMPANY ER Diagram −
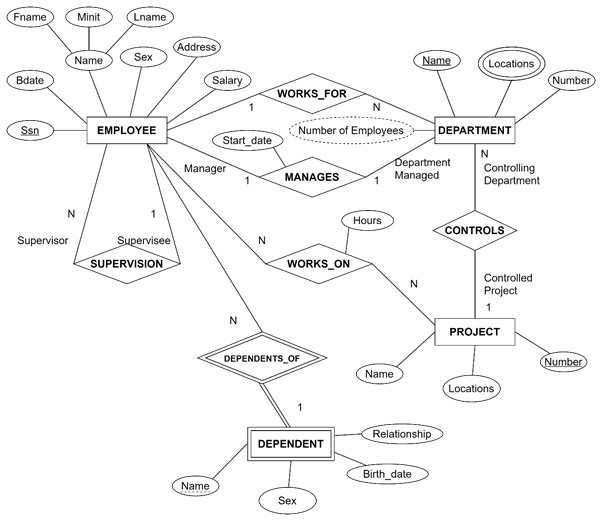
- MANAGES shows that each DEPARTMENT must have a manager (total participation for DEPARTMENT). However, an EMPLOYEE may not manage any department (partial participation).
- WORKS_ON connects EMPLOYEE and PROJECT, indicating an M relationship with the attribute Hours. It is describing the duration an employee works on a project.
- DEPENDENTS_OF illustrates EMPLOYEE and DEPENDENT with a 1
- ratio, showing that while employees might not have dependents (partial participation), each DEPENDENT must have an associated EMPLOYEE (total participation).
Special Considerations in Drawing the ER Diagram
Make a note of the following special considerations while drawing an ER diagram:
- Weak Entities and Identifying Relationships: In the ERD, we can see DEPENDENT is a weak entity. It is identified by its connection to EMPLOYEE. It cannot exist independently and is shown in a double rectangle. We can also notice that the DEPENDENTS_OF relationship is an identifying relationship, shown in a double diamond.
- Redundancy and Refinement: Here the attributes should be consolidated into relationships when necessary. For example, Manager and Manager_start_date from DEPARTMENT were moved to the MANAGES relationship to reduce redundancy.
- Composite and Multivalued Attributes: We can also see the attributes like Name for EMPLOYEE may be composite (consisting of Fname, Minit, Lname). Multivalued attributes like Locations for DEPARTMENT are shown using double ovals.
- Role Names − Add role names to relationships when the same entity participates more than once, such as SUPERVISION, where one EMPLOYEE acts as the supervisor and another as the supervisee.
Conclusion
In this chapter, we learned how to design an ER diagram step by step using a real-world example the COMPANY database. We identified the main entities, defined the relationships between them, marked participation and cardinality, and used special elements like weak entities and composite attributes to add clarity. This structured approach helps in designing ER diagrams for visualizing data models clearly for effective database design.
