- DBMS - Home
- DBMS - Overview
- DBMS - Architecture
- DBMS - Data Models
- DBMS - Data Schemas
- DBMS - Data Independence
- DBMS - System Environment
- Centralized and Client/Server Architecture
- DBMS - Classification
- Relational Model
- DBMS - Codd's Rules
- DBMS - Relational Data Model
- DBMS - Relational Model Constraints
- DBMS - Relational Database Schemas
- DBMS - Handling Constraint Violations
- Entity Relationship Model
- DBMS - ER Model Basic Concepts
- DBMS - ER Diagram Representation
- Relationship Types and Relationship Sets
- DBMS - Weak Entity Types
- DBMS - Generalization, Aggregation
- DBMS - Drawing an ER Diagram
- DBMS - Enhanced ER Model
- Subclass, Superclass and Inheritance in EER
- Specialization and Generalization in Extended ER Model
- Data Abstraction and Knowledge Representation
- Relational Algebra
- DBMS - Relational Algebra
- Unary Relational Operation
- Set Theory Operations
- DBMS - Database Joins
- DBMS - Division Operation
- DBMS - ER to Relational Model
- Examples of Query in Relational Algebra
- Relational Calculus
- Tuple Relational Calculus
- Domain Relational Calculus
- Relational Database Design
- DBMS - Functional Dependency
- DBMS - Inference Rules
- DBMS - Minimal Cover
- Equivalence of Functional Dependency
- Finding Attribute Closure and Candidate Keys
- Relational Database Design
- DBMS - Keys
- Super keys and candidate keys
- DBMS - Foreign Key
- Finding Candidate Keys
- Normalization in Database Designing
- Database Normalization
- First Normal Form
- Second Normal Form
- Third Normal Form
- Boyce Codd Normal Form
- Difference Between 4NF and 5NF
- Structured Query Language
- Types of Languages in SQL
- Querying in SQL
- CRUD Operations in SQL
- Aggregation Function in SQL
- Join and Subquery in SQL
- Views in SQL
- Trigger and Schema Modification
- Storage and File Structure
- DBMS - Storage System
- DBMS - File Structure
- DBMS - Secondary Storage Devices
- DBMS - Buffer and Disk Blocks
- DBMS - Placing File Records on Disk
- DBMS - Ordered and Unordered Records
- Indexing and Hashing
- DBMS - Indexing
- DBMS - Single-Level Ordered Indexing
- DBMS - Multi-level Indexing
- Dynamic B- Tree and B+ Tree
- DBMS - Hashing
- Query Processing and Optimization
- Heuristics in Query Processing
- Transaction and Concurrency
- DBMS - Transaction
- DBMS - Scheduling Transactions
- DBMS - Testing Serializability
- DBMS - Conflict Serializability
- DBMS - View Serializability
- DBMS - Concurrency Control
- DBMS - Lock Based Protocol
- DBMS - Timestamping based Protocol
- DBMS - Phantom Read Problem
- DBMS - Dirty Read Problem
- DBMS - Thomas Write Rule
- DBMS - Deadlock
- Backup and Recovery
- DBMS - Data Backup
- DBMS - Data Recovery
- DBMS Useful Resources
- DBMS - Quick Guide
- DBMS - Useful Resources
- DBMS - Discussion
DBMS - ER Diagram Representation
Let us now learn how the ER Model is represented by means of an ER diagram. Any object, for example, entities, attributes of an entity, relationship sets, and attributes of relationship sets, can be represented with the help of an ER diagram.
Entity
Entities are represented by means of rectangles. Rectangles are named with the entity set they represent.

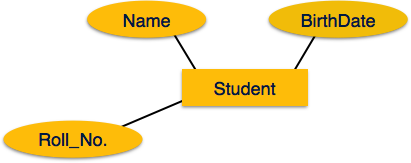
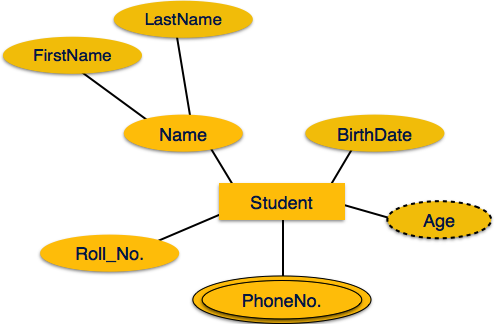
Attributes
Attributes are the properties of entities. Attributes are represented by means of ellipses. Every ellipse represents one attribute and is directly connected to its entity (rectangle).
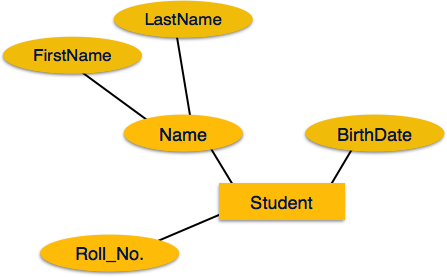
If the attributes are composite, they are further divided in a tree like structure. Every node is then connected to its attribute. That is, composite attributes are represented by ellipses that are connected with an ellipse.
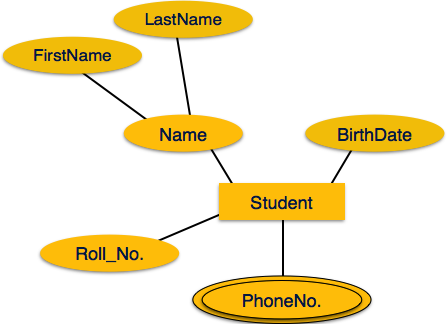
Multivalued attributes are depicted by double ellipse.
Derived attributes are depicted by dashed ellipse.
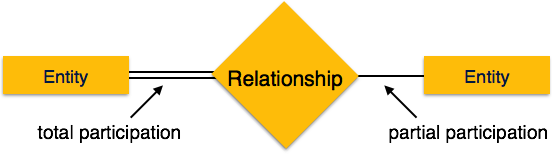
Relationship
Relationships are represented by diamond-shaped box. Name of the relationship is written inside the diamond-box. All the entities (rectangles) participating in a relationship, are connected to it by a line.
Binary Relationship and Cardinality
A relationship where two entities are participating is called a binary relationship. Cardinality is the number of instance of an entity from a relation that can be associated with the relation.
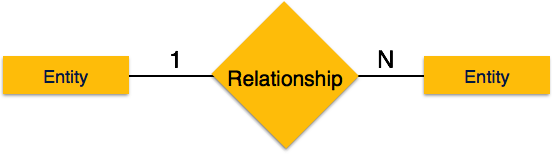
One-to-one − When only one instance of an entity is associated with the relationship, it is marked as '1:1'. The following image reflects that only one instance of each entity should be associated with the relationship. It depicts one-to-one relationship.
One-to-many − When more than one instance of an entity is associated with a relationship, it is marked as '1:N'. The following image reflects that only one instance of entity on the left and more than one instance of an entity on the right can be associated with the relationship. It depicts one-to-many relationship.
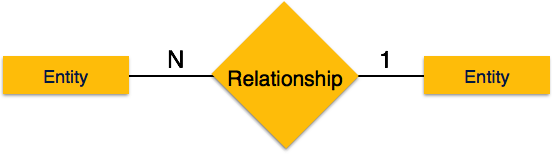
Many-to-one − When more than one instance of entity is associated with the relationship, it is marked as 'N:1'. The following image reflects that more than one instance of an entity on the left and only one instance of an entity on the right can be associated with the relationship. It depicts many-to-one relationship.
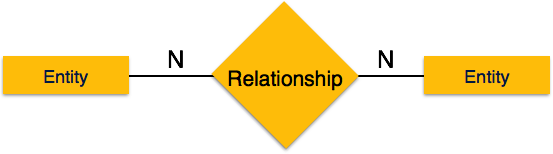
Many-to-many − The following image reflects that more than one instance of an entity on the left and more than one instance of an entity on the right can be associated with the relationship. It depicts many-to-many relationship.

Participation Constraints
Total Participation − Each entity is involved in the relationship. Total participation is represented by double lines.
Partial participation − Not all entities are involved in the relationship. Partial participation is represented by single lines.