- Excel Functions - Home
- Compatibility Functions
- Compatibility Functions
- BETADIST Function
- BETAINV Function
- BINOMDIST Function
- CEILING Function
- CHIDIST Function
- CHIINV Function
- CHITEST Function
- CONFIDENCE Function
- COVAR Function
- CRITBINOM Function
- EXPONDIST Function
- FDIST Function
- FINV Function
- FLOOR Function
- FTEST Function
- GAMMADIST Function
- GAMMAINV Function
- HYPGEOMDIST Function
- LOGINV Function
- LOGNORMDIST Function
- MODE Function
- NEGBINOMDIST Function
- NORMDIST Function
- NORMINV Function
- NORMSDIST Function
- NORMSINV Function
- PERCENTILE Function
- PERCENTRANK Function
- POISSON Function
- QUARTILE Function
- RANK Function
- STDEV Function
- STDEVP Function
- TDIST Function
- TINV Function
- TTEST Function
- VAR Function
- VARP Function
- WEIBULL Function
- ZTEST Function
- Logical Functions
- Logical Functions
- AND Function
- FALSE Function
- IF Function
- IFERROR Function
- IFNA Function
- IFS Function
- NOT Function
- OR Function
- SWITCH Function
- TRUE Function
- XOR Function
- Text Functions
- Text Functions
- ARRAYTOTEXT Function
- BAHTTEXT Function
- CHAR Function
- CLEAN Function
- CODE Function
- CONCAT Function
- CONCATENATE Function
- DBCS Function
- DOLLAR Function
- Exact Function
- FIND Function
- FINDB Function
- FIXED Function
- LEFT Function
- LEFTB Function
- LEN Function
- LENB Function
- LOWER Function
- MID Function
- MIDB Function
- NUMBERVALUE Function
- PHONETIC Function
- PROPER Function
- REPLACE Function
- REPLACEB Function
- REPT Function
- RIGHT Function
- RIGHTB Function
- SEARCH Function
- SEARCHB Function
- SUBSTITUTE Function
- T Function
- TEXT Function
- TEXTAFTER Function
- TEXTBEFORE Function
- TEXTJOIN Function
- TEXTSPLIT Function
- TRIM Function
- UNICHAR Function
- UNICODE Function
- UPPER Function
- VALUE Function
- VALUETOTEXT Function
- Date & Time Functions
- Date & Time Functions
- DATE Function
- DATEDIF Function
- DATEVALUE Function
- DAY Function
- DAYS Function
- DAYS360 Function
- EDATE Function
- EOMONTH Function
- HOUR Function
- ISOWEEKNUM Function
- MINUTE Function
- MONTH Function
- NETWORKDAYS Function
- NETWORKDAYS.INTL Function
- NOW Function
- SECOND Function
- TIME Function
- TIMEVALUE Function
- TODAY Function
- WEEKDAY Function
- WEEKNUM Function
- WORKDAY Function
- WORKDAY.INTL Function
- YEAR Function
- YEARFRAC Function
- Cube Functions
- Cube Functions
- CUBEKPIMEMBER Function
- CUBEMEMBER Function
- CUBEMEMBERPROPERTY Function
- CUBERANKEDMEMBER Function
- CUBESET Function
- CUBESETCOUNT Function
- CUBEVALUE Function
- Math Functions
- Math Functions
- ABS Function
- AGGREGATE Function
- ARABIC Function
- BASE Function
- CEILING.MATH Function
- COMBIN Function
- COMBINA Function
- DECIMAL Function
- DEGREES Function
- EVEN Function
- EXP Function
- FACT Function
- FACTDOUBLE Function
- FLOOR.MATH Function
- GCD Function
- INT Function
- LCM Function
- LN Function
- LOG Function
- LOG10 Function
- MDETERM Function
- MINVERSE Function
- MMULT Function
- MOD Function
- MROUND Function
- MULTINOMIAL Function
- MUNIT Function
- ODD Function
- PI Function
- POWER Function
- PRODUCT Function
- QUOTIENT Function
- RADIANS Function
- RAND Function
- RANDBETWEEN Function
- ROMAN Function
- ROUND Function
- ROUNDDOWN Function
- ROUNDUP Function
- SERIESSUM Function
- SIGN Function
- SQRT Function
- SQRTPI Function
- SUBTOTAL Function
- SUM Function
- SUMIF Function
- SUMIFS Function
- SUMPRODUCT Function
- SUMSQ Function
- SUMX2MY2 Function
- SUMX2PY2 Function
- SUMXMY2 Function
- TRUNC Function
- Trigonometric Functions
- Trigonometric Functions
- ACOS
- ACOSH Function
- ACOT Function
- ACOTH Function
- ASIN Function
- ASINH Function
- ATAN Function
- ATAN2 Function
- ATANH Function
- COS Function
- COSH Function
- COT Function
- COTH Function
- CSC Function
- CSCH Function
- SEC Function
- SECH Function
- SIN Function
- SINH Function
- TAN Function
- TANH Function
- Database Functions
- Database Functions
- DAVERAGE
- DCOUNT
- DCOUNTA
- DGET
- DMAX
- DMIN
- DPRODUCT
- DSTDEV
- DSTDEVP
- DSUM
- DVAR
- DVARP
- Dynamic Array Functions
- Dynamic Array Functions
- FILTER Function
- RANDARRAY Function
- SEQUENCE Function
- SORT Function
- SORTBY Function
- UNIQUE Function
- XLOOKUP Function
- XMATCH Function
- Engineering Functions
- Engineering Functions
- BESSELI Function
- BESSELJ Function
- BESSELK Function
- BESSELY Function
- BIN2DEC Function
- BIN2HEX Function
- BIN2OCT Function
- BITAND Function
- BITLSHIFT Function
- BITOR Function
- BITRSHIFT Function
- BITXOR Function
- COMPLEX Function
- CONVERT Function
- DEC2BIN Function
- DEC2HEX Function
- DEC2OCT Function
- DELTA Function
- ERF Function
- ERF.PRECISE Function
- ERFC Function
- ERFC.PRECISE Function
- GESTEP Function
- HEX2BIN Function
- HEX2DEC Function
- HEX2OCT Function
- IMABS Function
- IMAGINARY Function
- IMARGUMENT Function
- IMCONJUGATE Function
- IMCOS Function
- IMCOSH Function
- IMCOT Function
- IMCSC Function
- IMCSCH Function
- IMDIV Function
- IMEXP Function
- IMLN Function
- IMLOG2 Function
- IMLOG10 Function
- IMPOWER Function
- IMPRODUCT Function
- IMREAL Function
- IMSEC Function
- IMSECH Function
- IMSIN Function
- IMSINH Function
- IMSQRT Function
- IMSUB Function
- IMSUM Function
- IMTAN Function
- OCT2BIN Function
- OCT2DEC Function
- OCT2HEX Function
- Financial Functions
- Financial Functions
- ACCRINT Function
- ACCRINTM Function
- AMORDEGRC Function
- AMORLINC Function
- COUPDAYBS Function
- COUPDAYS Function
- COUPDAYSNC Function
- COUPNCD Function
- COUPNUM Function
- COUPPCD Function
- CUMIPMT Function
- CUMPRINC Function
- DB Function
- DDB Function
- DISC Function
- DOLLARDE Function
- DOLLARFR Function
- DURATION Function
- EFFECT Function
- FV Function
- FVSCHEDULE Function
- INTRATE Function
- IPMT Function
- IRR Function
- ISPMT Function
- MDURATION Function
- MIRR Function
- NOMINAL Function
- NPER Function
- NPV Function
- ODDFPRICE Function
- ODDFYIELD Function
- ODDLPRICE Function
- ODDLYIELD Function
- PDURATION Function
- PMT Function
- PPMT Function
- PRICE Function
- PRICEDISC Function
- PRICEMAT Function
- PV Function
- RATE Function
- RECEIVED Function
- RRI Function
- SLN Function
- SYD Function
- TBILLEQ Function
- TBILLPRICE Function
- TBILLYIELD Function
- VDB Function
- XIRR Function
- XNPV Function
- YIELD Function
- YIELDDISC Function
- YIELDMAT Function
- Information Functions
- Information Functions
- CELL Function
- ERROR.TYPE Function
- INFO Function
- ISBLANK Function
- ISERR Function
- ISERROR Function
- ISEVEN Function
- ISFORMULA Function
- ISLOGICAL Function
- ISNA Function
- ISNONTEXT Function
- ISNUMBER Function
- ISODD Function
- ISREF Function
- ISTEXT Function
- N Function
- NA Function
- SHEET Function
- SHEETS Function
- TYPE Function
- Lookup & Reference Functions
- Lookup & Reference Functions
- ADDRESS Function
- AREAS Function
- CHOOSE Function
- COLUMN Function
- COLUMNS Function
- FORMULATEXT Function
- GETPIVOTDATA Function
- HLOOKUP Function
- HYPERLINK Function
- INDEX Function
- INDIRECT Function
- LOOKUP Function
- MATCH Function
- OFFSET Function
- ROW Function
- ROWS Function
- RTD Function
- TRANSPOSE Function
- VLOOKUP Function
- Statistical Functions
- Statistical Functions
- AVEDEV Function
- AVERAGE Function
- AVERAGEA Function
- AVERAGEIF Function
- AVERAGEIFS Function
- BETA.DIST Function
- BETA.INV Function
- BINOM.DIST Function
- BINOM.DIST.RANGE Function
- BINOM.INV Function
- CHISQ.DIST Function
- CHISQ.DIST.RT Function
- CHISQ.INV Function
- CHISQ.INV.RT Function
- CHISQ.TEST Function
- CONFIDENCE.NORM Function
- CONFIDENCE.T Function
- CORREL Function
- COUNT Function
- COUNTA Function
- COUNTBLANK Function
- COUNTIF Function
- COUNTIFS Function
- COVARIANCE.P Function
- COVARIANCE.S Function
- DEVSQ Function
- EXPON.DIST Function
- F.DIST Function
- F.DIST.RT Function
- F.INV Function
- F.INV.RT Function
- F.TEST Function
- FISHER Function
- FISHERINV Function
- FORECAST Function
- FORECAST.ETS Function
- FORECAST.ETS.CONFINT Function
- FORECAST.ETS.SEASONALITY Function
- FORECAST.ETS.STAT Function
- FORECAST.LINEAR Function
- FREQUENCY Function
- GAMMA Function
- GAMMA.DIST Function
- GAMMA.INV Function
- GAMMALN Function
- GAMMALN.PRECISE Function
- GAUSS Function
- GEOMEAN
- GROWTH
- HARMEAN
- HYPGEOM.DIST
- INTERCEPT Function
- KURT Function
- LARGE Function
- LINEST Function
- LOGEST Function
- LOGNORM.DIST Function
- LOGNORM.INV Function
- MAX Function
- MAXA Function
- MAXIFS Function
- MEDIAN Function
- MIN Function
- MINA Function
- MINIFS Function
- MODE.MULT Function
- MODE.SNGL Function
- NEGBINOM.DIST Function
- NORM.DIST Function
- NORM.INV Function
- NORM.S.DIST Function
- NORM.S.INV Function
- PEARSON Function
- PERCENTILE.EXC
- PERCENTILE.INC
- PERCENTRANK.EXC
- PERCENTRANK.INC
- PERMUT
- PERMUTATIONA
- PHI
- POISSON.DIST
- PROB
- QUARTILE.EXC
- QUARTILE.INC
- RANK.AVG
- RANK.EQ
- RSQ
- SKEW
- SKEW.P
- SLOPE
- SMALL
- STANDARDIZE
- STDEV.P
- STDEV.S
- STDEVA
- STDEVPA
- STEYX
- T.DIST
- T.DIST.2T
- T.DIST.RT
- T.INV
- T.INV.2T
- T.TEST
- TREND
- TRIMMEAN Function
- VAR.P Function
- VAR.S Function
- VARA Function
- VARPA Function
- WEIBULL.DIST Function
- Z.TEST Function
- Web Functions
- Web Functions
- ENCODEURL Function
- FILTERXML Function
- WEBSERVICE Function
Excel - T.TEST Function
Description
The T.TEST function returns the probability associated with a Student's t-Test. Use T.TEST to determine whether two samples are likely to have come from the same two underlying populations that have the same mean.
Syntax
T.TEST (array1,array2,tails,type)
Arguments
| Argument | Description | Required/ Optional |
|---|---|---|
| Array1 | The first data set. | Required |
| Array2 | The second data set. | Required |
| Tails |
Specifies the number of distribution tails. If tails = 1, T.TEST uses the one-tailed distribution. If tails = 2, T.TEST uses the two-tailed distribution. |
Required |
| Type |
The kind of t-Test to perform. Look at the Type-Test Table given below. |
Required |
Type-Test Table
| Type | Test Performed |
|---|---|
| 1 | Paired |
| 2 | Two-sample equal variance (homoscedastic) |
| 3 | Two-sample unequal variance (heteroscedastic) |
Notes
T.TEST uses the data in array1 and array2 to compute a non-negative t-statistic
If tails=1, T.TEST returns the probability of a higher value of the t-statistic under the assumption that array1 and array2 are samples from populations with the same mean.
If tails=2, T.TEST returns the value that is double that returned when tails=1 and corresponds to the probability of a higher absolute value of the t-statistic under the same population means assumption.
The tails and type arguments are truncated to integers.
If array1 and array2 have a different number of data points, and type = 1 (paired), T.TEST returns the #N/A error value.
If tails or type is nonnumeric, T.TEST returns the #VALUE! error value.
If tails is any value other than 1 or 2, T.TEST returns the #NUM! error value.
If type is any value other than 1, 2 or 3, T.TEST returns the #NUM! error value.
Applicability
Excel 2010, Excel 2013, Excel 2016
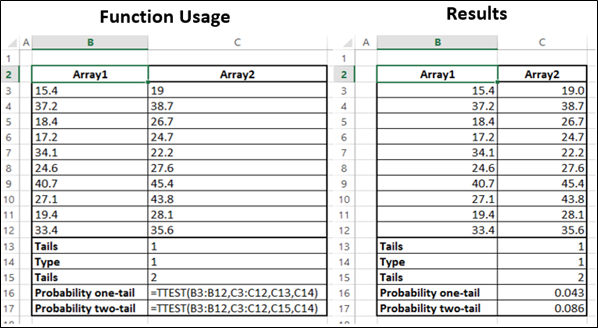
Example