- Project Management Concepts
- Project Management Home
- Activity Based Costing
- Agile Project Management
- Basic Management Skills
- Basic Quality Tools
- Benchmarking Process
- Cause and Effect Diagram
- Change Management Process
- Communication Blockers
- Communication Channels
- Communication Methods
- Communication Models
- Communications Management
- Conflict Management
- Crisis Management
- Critical Chain Scheduling
- Critical Path Method
- Decision Making Process
- Design of Experiment
- Effective Communication Skills
- Effective Presentation Skills
- Enterprise Resource Planning
- Event Chain Methodology
- Extreme Project Management
- Gantt Chart Tool
- Just-In-Time Manufacturing
- Knowledge Management
- Leads, Lags and Floats
- Management Best Practices
- Management Styles
- Management by Objectives
- Monte Carlo Analysis
- Motivation Theories
- Negotiation Skills
- Organizational Structures
- PERT Estimation Technique
- PRINCE2 Project Methodology
- Pareto Chart Tool
- Powerful Leadership Skills
- Process Based Management
- Procurement Documents
- Procurement Management
- Project Activity Diagram
- Project Charter
- Project Contract Types
- Project Cost Control
- Project Kick-off Meeting
- Project Lessons Learned
- Project Management Methodologies
- Project Management Office
- Project Management Processes
- Project Management Tools
- Project Management Triangle
- Project Manager Goals
- Project Portfolio Management
- Project Quality Plan
- Project Records Management
- Project Risk Categories
- Project Risk Management
- Project Scope Definition
- Project Selection Method
- Project Success Criteria
- Project Time Management
- Project Workforce Management
- Project Management Softwares
- QC and QA Processes
- RACI Chart Tool
- Recognition and Rewards
- Requirement Collection
- Resource Leveling
- Staffing Management Plan
- Stakeholder Management
- Statement of Work (SOW)
- Stress Management Techniques
- Structured Brainstorming
- Succession Planning
- Supply Chain Management
- Team Building Program
- Team Motivation
- The Balanced Scorecard
- The Halo Effect
- The Make or Buy Decision
- The Rule of Seven
- The Virtual Team
- Total Productive Maintenance
- Total Quality Management
- Traditional Project Management
- Work Breakdown Structure
Project Activity Diagram
Introduction
When it comes to a project, the entire project is divided into many interdependent tasks. In this set of tasks, the sequence or the order of the tasks is quite important.
If the sequence is wrong, the end result of the project might not be what the management expected.
Some tasks in the projects can safely be performed parallel to other tasks. In a project activity diagram, the sequence of the tasks is simply illustrated.
There are many tools that can be used for drawing project activity diagrams. Microsoft Project is one of the most popular software for this type of work.
In addition to that, Microsoft Vision (for Windows) and Omni Graffle (for Mac) can be used to draw activity diagrams.
The Workflow
Have you seen process flow diagrams? If yes, then activity diagrams takes the same shape. Usually there are two main shapes in activity diagrams, boxes and arrows.
Boxes of the activity diagram indicate the tasks and the arrows show the relationships. Usually, the relationships are the sequences that take place in the activities.
Following is an example of activity diagram with tasks in boxes and relationship represented by arrows.
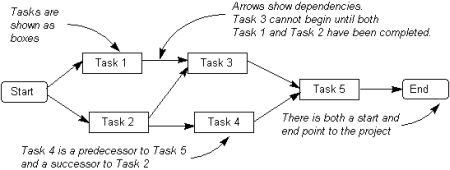
This type of activity diagram is also known as activity-on-node diagram. This is due to the fact that all activities (tasks) are shown on the nodes (boxes).
Alternatively, there is another way of presenting an activity diagram. This is called activity-on-arrow diagram. In this diagram, activities (tasks) are presented by the arrows.
Compared to activity-on-node diagrams, activity-on-arrow diagrams introduce a little confusion. Therefore, in most instances, people often use activity-on-nodes diagrams. Following is an activity-on-arrow diagram:
How to Draw Activity Diagram?
Creating an activity diagram is easy. You can use a paper-based material such as a post it note or software for this purpose. Regardless of the medium used, the process of creating the activity diagram remains the same.
Following are main steps involved in creating an activity diagram:
Step 1
First of all, identify the tasks in the project. You can use WBS (Work Breakdown Structure) for this purpose and there is no need to repeat the same.
Just use the same tasks breakdown for the activity diagram as well. If you use software for creating the activity diagram (which is recommended), create a box for each activity.
Illustrate all boxes in the same size in order to avoid any confusion. Make sure all your tasks have the same granularity.
Step 2
You can add more information to the task boxes, such as who is doing the task and the timeframes. You can add this information inside the box or can add it somewhere near the box.
Step 3
Now, arrange the boxes in the sequence that they are performed during the project execution. The early tasks will be at the left hand side and the tasks performed at the later part of the project execution will be at the right hand side. The tasks that can be performed in parallel should be kept parallel to each other (vertically).
You may have to adjust the sequence a number of times until you get it right. This is why software is an easy tool for creating activity diagrams.
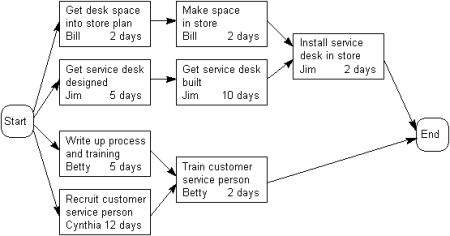
Step 4
Now, use arrows to join task boxes. These arrows will show the sequence of the tasks. Sometimes, a 'start' and an 'end' box can be added to clearly present the start and the end of the project.
To understand what we have done in the above four steps, please refer to the following activity diagram:
Conclusion
Activity diagrams can be used for illustrating the sequence of project tasks. These diagrams can be created with a minimum effort and gives you a clear understanding of interdependent tasks.
In addition, the activity diagram is an input for the critical path method.