- Project Management Concepts
- Project Management Home
- Activity Based Costing
- Agile Project Management
- Basic Management Skills
- Basic Quality Tools
- Benchmarking Process
- Cause and Effect Diagram
- Change Management Process
- Communication Blockers
- Communication Channels
- Communication Methods
- Communication Models
- Communications Management
- Conflict Management
- Crisis Management
- Critical Chain Scheduling
- Critical Path Method
- Decision Making Process
- Design of Experiment
- Effective Communication Skills
- Effective Presentation Skills
- Enterprise Resource Planning
- Event Chain Methodology
- Extreme Project Management
- Gantt Chart Tool
- Just-In-Time Manufacturing
- Knowledge Management
- Leads, Lags and Floats
- Management Best Practices
- Management Styles
- Management by Objectives
- Monte Carlo Analysis
- Motivation Theories
- Negotiation Skills
- Organizational Structures
- PERT Estimation Technique
- PRINCE2 Project Methodology
- Pareto Chart Tool
- Powerful Leadership Skills
- Process Based Management
- Procurement Documents
- Procurement Management
- Project Activity Diagram
- Project Charter
- Project Contract Types
- Project Cost Control
- Project Kick-off Meeting
- Project Lessons Learned
- Project Management Methodologies
- Project Management Office
- Project Management Processes
- Project Management Tools
- Project Management Triangle
- Project Manager Goals
- Project Portfolio Management
- Project Quality Plan
- Project Records Management
- Project Risk Categories
- Project Risk Management
- Project Scope Definition
- Project Selection Method
- Project Success Criteria
- Project Time Management
- Project Workforce Management
- Project Management Softwares
- QC and QA Processes
- RACI Chart Tool
- Recognition and Rewards
- Requirement Collection
- Resource Leveling
- Staffing Management Plan
- Stakeholder Management
- Statement of Work (SOW)
- Stress Management Techniques
- Structured Brainstorming
- Succession Planning
- Supply Chain Management
- Team Building Program
- Team Motivation
- The Balanced Scorecard
- The Halo Effect
- The Make or Buy Decision
- The Rule of Seven
- The Virtual Team
- Total Productive Maintenance
- Total Quality Management
- Traditional Project Management
- Work Breakdown Structure
Gantt Chart Tool
Introduction
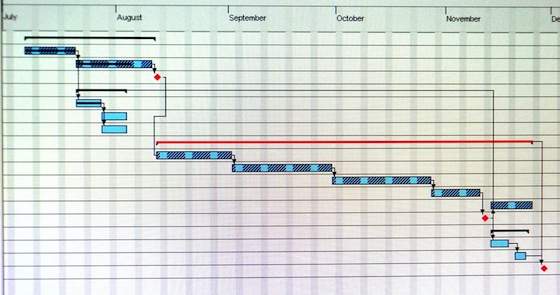
Gantt chart is a type of a bar chart that is used for illustrating project schedules. Gantt charts can be used in any projects that involve effort, resources, milestones and deliveries.
At present, Gantt charts have become the popular choice of project managers in every field.
Gantt charts allow project managers to track the progress of the entire project. Through Gantt charts, the project manager can keep a track of the individual tasks as well as of the overall project progression.
In addition to tracking the progression of the tasks, Gantt charts can also be used for tracking the utilization of the resources in the project. These resources can be human resources as well as materials used.
Gantt chart was invented by a mechanical engineer named Henry Gantt in 1910. Since the invention, Gantt chart has come a long way. By today, it takes different forms from simple paper based charts to sophisticated software packages.
The Use
As we have already discussed, Gantt charts are used for project management purposes. In order to use Gantt charts in a project, there are a few initial requirements fulfilled by the project.
First of all, the project should have a sufficiently detailed Work Breakdown Structure (WBS).
Secondly, the project should have identified its milestones and deliveries.
In some instances, project managers try to define the work break down structure while creating Gantt chart. This is one of the frequently practised errors in using Gantt charts. Gantt charts are not designed to assist WBS process; rather Gantt charts are for task progress tracking.
Gantt charts can be successfully used in projects of any scale. When using Gantt charts for large projects, there can be an increased complexity when tracking the tasks.
This problem of complexity can be successfully overcome by using computer software packages designed for offering Gantt chart functionalities.
Tools Available
There are dozens of Gantt chart tools that can be used for successful project tracking. These tools usually vary by the feature offered.
The simplest kind of Gantt chart can be created using a software tool such as Microsoft Excel. For that matter, any spreadsheet tool can be used to design a Gantt chart template.
If the project is small scale and does not involve many parallel tasks, a spreadsheet based Gantt chart can be the most effective type.
Microsoft Project is one of the key Gantt chart tools used today. Especially for software development projects, MS Project based Gantt charts are essential to track the hundreds of parallel tasks involved in the software development life cycle.
There are many other Gantt chart tools available for free and for price. The features offered by these tools range from the same features offered by Excel based Gantt charts to MS Project Gantt charts. These tools come with different price tags and feature levels, so one can select the suitable Gantt chart tool for the purpose in hand.
Creating Your Own
Sometimes, one may decide to create their own Gantt chart tool without buying an existing one. If this is the case, first of all, one should search the Internet for free Gantt chart templates.
This way, one may actually find the exact Gantt chart template (probably in Excel) required for the purpose. In case, if no match is found, then it is sensible to create one's own.
Excel is the most popular tool for creating custom Gantt charts. Of course, one can create a Gantt chart from scratch in Excel, but it is always advisable to use a Project Management add-on in Excel to create Gantt charts.
These project management add-ons are published by Microsoft and other third-party companies.
Advantages & Disadvantages
The ability to grasp the overall status of a project and its tasks at once is the key advantage in using a Gantt chart tool. Therefore, upper management or the sponsors of the project can make informed decisions just by looking at the Gantt chart tool.
The software-based Gantt charts are able to show the task dependencies in a project schedule. This helps to identify and maintain the critical path of a project schedule.
Gantt chart tools can be used as the single entity for managing small projects. For small projects, no other documentation may be required; but for large projects, the Gantt chart tool should be supported by other means of documentation.
For large projects, the information displayed in Gantt charts may not be sufficient for decision making.
Although Gantt charts accurately represent the cost, time and scope aspects of a project, it does not elaborate on the project size or size of the work elements. Therefore, the magnitude of constraints and issues can be easily misunderstood.
Conclusion
Gantt chart tools make project manager's life easy. Therefore, Gantt chart tools are important for successful project execution.
Identifying the level of detail required in the project schedule is the key when selecting a suitable Gantt chart tool for the project.
One should not overly complicate the project schedules by using Gantt charts to manage the simplest tasks.