- Project Management Concepts
- Project Management Home
- Activity Based Costing
- Agile Project Management
- Basic Management Skills
- Basic Quality Tools
- Benchmarking Process
- Cause and Effect Diagram
- Change Management Process
- Communication Blockers
- Communication Channels
- Communication Methods
- Communication Models
- Communications Management
- Conflict Management
- Crisis Management
- Critical Chain Scheduling
- Critical Path Method
- Decision Making Process
- Design of Experiment
- Effective Communication Skills
- Effective Presentation Skills
- Enterprise Resource Planning
- Event Chain Methodology
- Extreme Project Management
- Gantt Chart Tool
- Just-In-Time Manufacturing
- Knowledge Management
- Leads, Lags and Floats
- Management Best Practices
- Management Styles
- Management by Objectives
- Monte Carlo Analysis
- Motivation Theories
- Negotiation Skills
- Organizational Structures
- PERT Estimation Technique
- PRINCE2 Project Methodology
- Pareto Chart Tool
- Powerful Leadership Skills
- Process Based Management
- Procurement Documents
- Procurement Management
- Project Activity Diagram
- Project Charter
- Project Contract Types
- Project Cost Control
- Project Kick-off Meeting
- Project Lessons Learned
- Project Management Methodologies
- Project Management Office
- Project Management Processes
- Project Management Tools
- Project Management Triangle
- Project Manager Goals
- Project Portfolio Management
- Project Quality Plan
- Project Records Management
- Project Risk Categories
- Project Risk Management
- Project Scope Definition
- Project Selection Method
- Project Success Criteria
- Project Time Management
- Project Workforce Management
- Project Management Softwares
- QC and QA Processes
- RACI Chart Tool
- Recognition and Rewards
- Requirement Collection
- Resource Leveling
- Staffing Management Plan
- Stakeholder Management
- Statement of Work (SOW)
- Stress Management Techniques
- Structured Brainstorming
- Succession Planning
- Supply Chain Management
- Team Building Program
- Team Motivation
- The Balanced Scorecard
- The Halo Effect
- The Make or Buy Decision
- The Rule of Seven
- The Virtual Team
- Total Productive Maintenance
- Total Quality Management
- Traditional Project Management
- Work Breakdown Structure
PERT Estimation Technique
Introduction
Before any activity begins related to the work of a project, every project requires an advanced, accurate time estimate. Without an accurate estimate, no project can be completed within the budget and the target completion date.
Developing an estimate is a complex task. If the project is large and has many stakeholders, things can be more complex.
Therefore, there have been many initiatives to come up with different techniques for estimation phase of the project in order to make the estimation more accurate.
PERT (Program Evaluation and Review Technique) is one of the successful and proven methods among the many other techniques, such as, CPM, Function Point Counting, Top-Down Estimating, WAVE, etc.
PERT was initially created by the US Navy in the late 1950s. The pilot project was for developing Ballistic Missiles and there have been thousands of contractors involved.
After PERT methodology was employed for this project, it actually ended two years ahead of its initial schedule.
The PERT Basics
At the core, PERT is all about management probabilities. Therefore, PERT involves in many simple statistical methods as well.
Sometimes, people categorize and put PERT and CPM together. Although CPM (Critical Path Method) shares some characteristics with PERT, PERT has a different focus.
Same as most of other estimation techniques, PERT also breaks down the tasks into detailed activities.
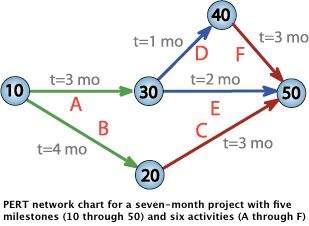
Then, a Gantt chart will be prepared illustrating the interdependencies among the activities. Then, a network of activities and their interdependencies are drawn in an illustrative manner.
In this map, a node represents each event. The activities are represented as arrows and they are drawn from one event to another, based on the sequence.
Next, the Earliest Time (TE) and the Latest Time (TL) are figured for each activity and identify the slack time for each activity.
When it comes to deriving the estimates, the PERT model takes a statistical route to do that. We will cover more on this in the next two sections.
Following is an example PERT chart:
The Three Chances
There are three estimation times involved in PERT; Optimistic Time Estimate (TOPT), Most Likely Time Estimate (TLIKELY), and Pessimistic Time Estimate (TPESS).
In PERT, these three estimate times are derived for each activity. This way, a range of time is given for each activity with the most probable value, TLIKELY.
Following are further details on each estimate:
1. TOPT
This is the fastest time an activity can be completed. For this, the assumption is made that all the necessary resources are available and all predecessor activities are completed as planned.
2. TLIKELY
Most of the times, project managers are asked only to submit one estimate. In that case, this is the estimate that goes to the upper management.
3. TPESS
This is the maximum time required to complete an activity. In this case, it is assumed that many things go wrong related to the activity. A lot of rework and resource unavailability are assumed when this estimation is derived.
The PERT Mathematics
BETA probability distribution is what works behind PERT. The expected completion time (E) is calculated as below:
E = (TOPT + 4 x TLIEKLY + TPESS) / 6
At the same time, the possible variance (V) of the estimate is calculated as below:
V = (TPESS - TOPT)^2 / 6^2
Now, following is the process we follow with the two values:
For every activity in the critical path, E and V are calculated.
Then, the total of all Es are taken. This is the overall expected completion time for the project.
Now, the corresponding V is added to each activity of the critical path. This is the variance for the entire project. This is done only for the activities in the critical path as only the critical path activities can accelerate or delay the project duration.
Then, standard deviation of the project is calculated. This equals to the square root of the variance (V).
Now, the normal probability distribution is used for calculating the project completion time with the desired probability.
Conclusion
The best thing about PERT is its ability to integrate the uncertainty in project times estimations into its methodology.
It also makes use of many assumption that can accelerate or delay the project progress. Using PERT, project managers can have an idea of the possible time variation for the deliveries and offer delivery dates to the client in a safer manner.