- SAP Analytics Cloud - Home
- SAP Analytics Cloud - Introduction
- SAP Analytics Cloud - Registration (Trial)
- SAP Analytics Cloud - System Requirements
- SAP Analytics Cloud - User Interface
- SAP Analytics Cloud - Export Options
- SAP Analytics Cloud - Creating First Story
- SAP Analytics Cloud - Exploring Data (Charts)
- SAP Analytics Cloud - Using Filters
- SAP Analytics Cloud - Styling Template
- SAP Analytics Cloud - Using Sharing Option
- SAP Analytics Cloud - Bookmarks
- SAP Analytics Cloud - Role Configuration
- Customizing Home Screen
- SAP Analytics Cloud - Designer
- SAP Analytics Cloud - Application
- SAP Analytics Cloud - User Roles
- SAP Analytics Cloud - Assigning Roles
- SAP Analytics Cloud - Creating Teams
- SAP Analytics Cloud - Admin for Support
- SAP Analytics Cloud - Adding Comments
- SAP Analytics Cloud - Digital Boardroom
- SAP Analytics Cloud - Support
- SAP Analytics Cloud Resources
- SAP Analytics Cloud - Quick Guide
- SAP Analytics Cloud - Useful Resources
- SAP Analytics Cloud - Discussion
SAP Analytics Cloud - User Interface
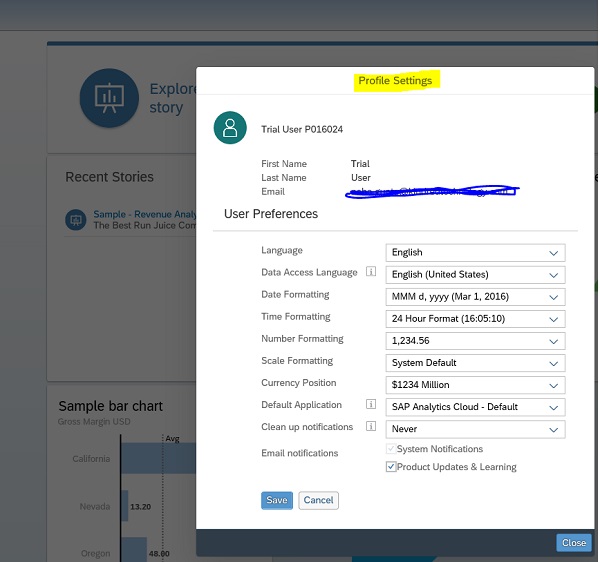
When you activate your account, you will land to home page of SAP Analytics screen. You can update your profile details be clicking on edit button under Profile settings. It shows you option to update these fields −
- Language
- Data Formatting
- Time Formatting
- Number Formatting
- Scale Formatting
- Currency position
- Default application
- Cleanup notifications
- Email notification settings
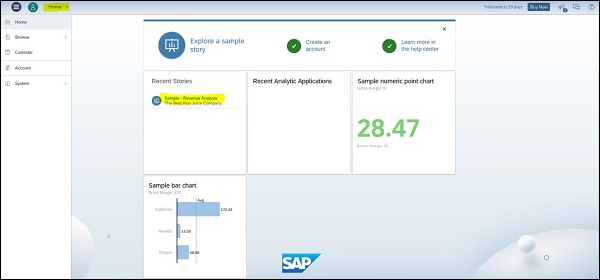
After that, go ahead and explore SAP Analytics cloud tool. You can try the sample story, to get an idea of what you'll be able to do using this tool. Below page shows you home screen of SAP Analytics Cloud −
When you click on sample story, you will see 3 different panes and right side you have a control option to use different options under each pane.
- Summary
- Analysis
- Overview
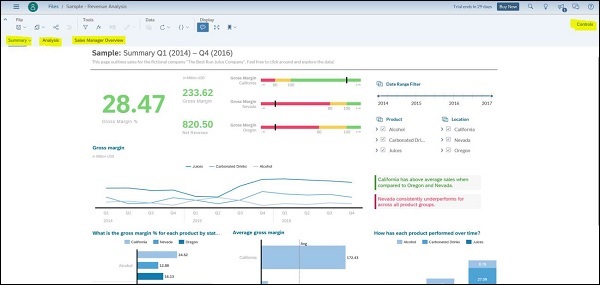
To use controls, select any of the object in Summary and click on Control button on top right corner. You can also use More Actions ... option at top of each object to see various options that can apply to any of visual.
Below options can be used to update the charts −
- Sort
- Rank
- Add Comment
- Expand Title
- Export
- FullScreen
- Pin to Home
- View Controls
When you go to Analysis tab, it shows you the deep insight in Summary tab. It shows you the possible factors contributing to that visualization. You can also use More Actions ... option under Analysis to update results as per requirement.
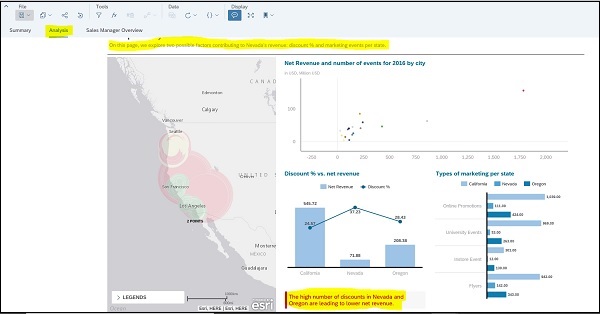
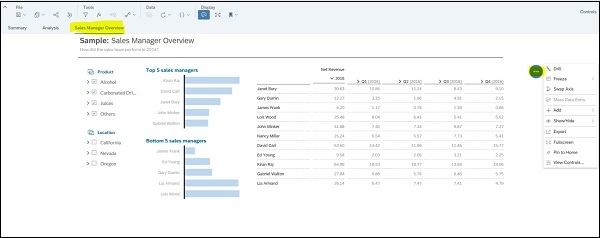
Sales Manager Overview
This tab shows you few top n and bottom n charts as per role. You can use More Actions ... option to further drill or explore this data.