- SAP Analytics Cloud - Home
- SAP Analytics Cloud - Introduction
- SAP Analytics Cloud - Registration (Trial)
- SAP Analytics Cloud - System Requirements
- SAP Analytics Cloud - User Interface
- SAP Analytics Cloud - Export Options
- SAP Analytics Cloud - Creating First Story
- SAP Analytics Cloud - Exploring Data (Charts)
- SAP Analytics Cloud - Using Filters
- SAP Analytics Cloud - Styling Template
- SAP Analytics Cloud - Using Sharing Option
- SAP Analytics Cloud - Bookmarks
- SAP Analytics Cloud - Role Configuration
- Customizing Home Screen
- SAP Analytics Cloud - Designer
- SAP Analytics Cloud - Application
- SAP Analytics Cloud - User Roles
- SAP Analytics Cloud - Assigning Roles
- SAP Analytics Cloud - Creating Teams
- SAP Analytics Cloud - Admin for Support
- SAP Analytics Cloud - Adding Comments
- SAP Analytics Cloud - Digital Boardroom
- SAP Analytics Cloud - Support
- SAP Analytics Cloud Resources
- SAP Analytics Cloud - Quick Guide
- SAP Analytics Cloud - Useful Resources
- SAP Analytics Cloud - Discussion
SAP Analytics Cloud - Quick Guide
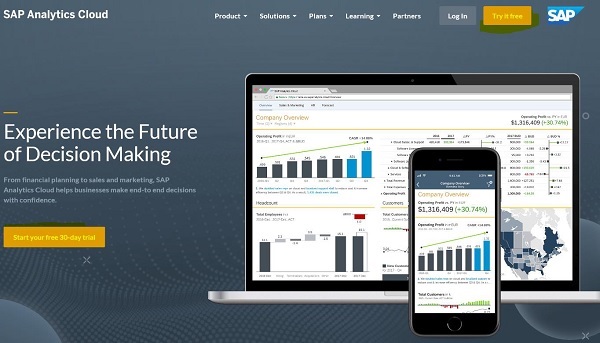
SAP Analytics Cloud - Introduction
SAP Analytics for cloud is cloud SaaS based Business Intelligence tool provided by SAP company. It was formerly known as BusinessObjects for cloud. It provides all the key functionalities of an Analytics tool to SAP business users.
This tool is developed by SAP on HANA based BI platform and provides analytics compatibility from data coming from different database, CRM and ERP solutions. You can fetch data from Microsoft SQL, ERP solutions and Salesforce. Business users can compile the data, perform the data discovery, ad-hoc reporting and analysis to support predictive planning. SAP Analytics tool converts the raw data from transactional system into meaningful insight for making better decisions.
Analytics feature in SAP tool depends on data algorithms, programming, and operations research to get data insight and to help the business in finding meaningful information from data coming from multiple data sources. This information is used by all enterprises to perform the business planning and forecasting.
Key capabilities provided by SAP Cloud for Analytics includes −
- Business Intelligence
- Augmented Analytics
- Planning
- Modelling
- Smart Transformation
SAP Analytics tool uses machine learning technology to perform data cleaning, identify possible data errors and suggest filtering options. Modeling feature in Analytics cloud can be used to enhance your data and create hierarchies for deeper data insight.
To know more about this product, costing and available plans, you can visit SAP Product page as below −
https://www.sap.com/products/data-cloud/cloud-analytics.html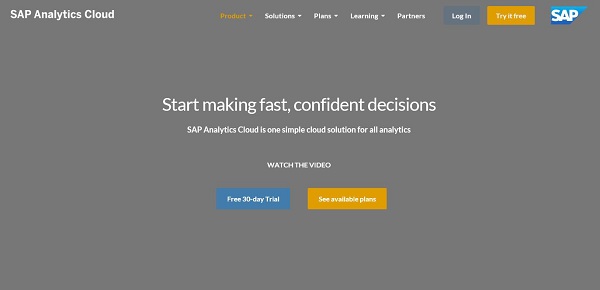
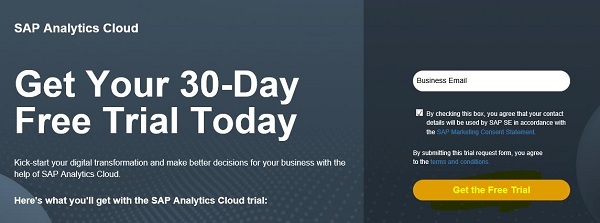
SAP also provides 30 days free trial version for this tool. To start with 30 days trial, you need to provide your official email ID. For registration, click on Free 30-day trial button.
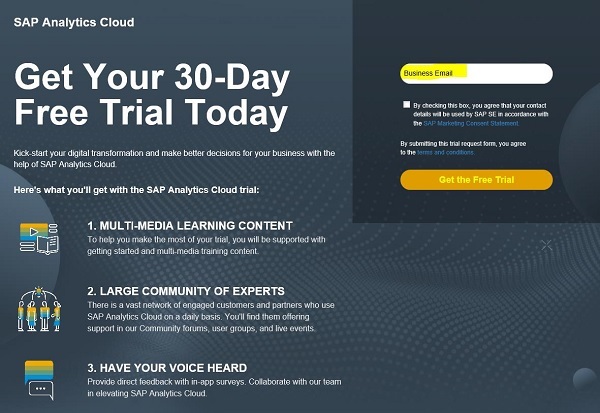
Enter your business email and accept the T&Cs from SAP to start using trial period. Once you enter your email ID, you will receive an email from SAP with welcome email.
Key Features of SAP Analytics Cloud
SAP Analytics cloud provides below key features to end users −
- Data Discovery
- Machine Leaning capabilities
- Integrated Financial and Business Planning
- Predictive Analysis
- Automated data cleansing
- Data exploration and visualization
- Role-Based customization for different users
- Use of custom widgets
- Applications Integration with on-premise sources
- Mobile extension to connect with colleagues via iPhone/iPad
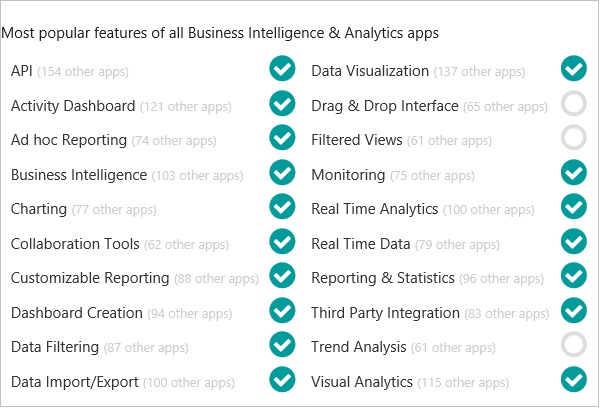
SAP Analytics Cloud is one of most recommended software for Business Intelligence, these days. When you compare this tool with other similar tools, you can see vast range of features provided for end users - drag and drop reporting, real time analytics and BI insights, creating data visualizations, dashboards and interactive stories, etc.
When you compare SAP Analytics cloud with other BI tools, below list the key feature supported −
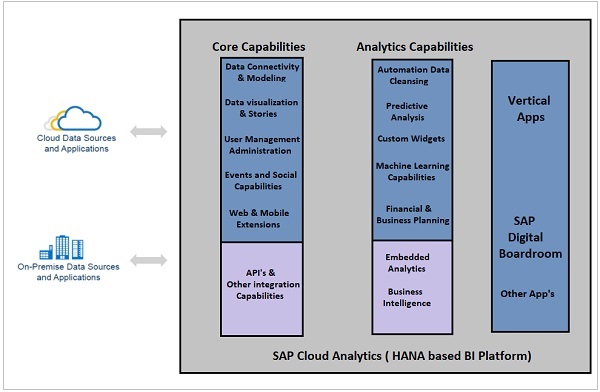
The SAP Analytics Cloud provide below tiers based on its capabilities −
Core Capabilities
This includes key capabilities provided by HANA cloud platform and offers capabilities like data connectivity and modeling, social collaboration, security and administration, web and mobile extensions and APIs based integration capabilities to integrate apps into existing BI solution.
Analytic Capabilities
This includes key capabilities of SAP Cloud platform related to analytics and data processing. These features are focused based on analytics, data cleansing and visualization, use of custom widgets, Predictive analysis capabilities, business and financial planning features and use of Machine learning capabilities.
Applications
You can also stitch all the analytic applications into a boardroom and that can allow you to view in multiple screen, multiple metric access to your enterprise metrics.
With this you can also drill to lowest level of your metrics.
SAP Analytics Cloud - Registration (Trial)
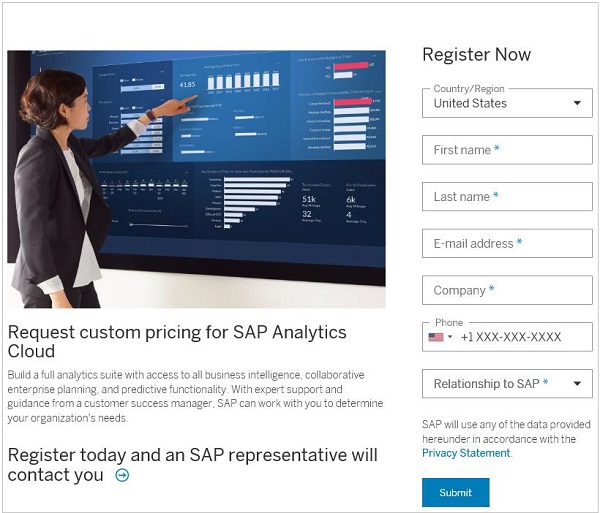
Like other SAP products, SAP Analytics could also have free 30-day trial. This can be used by companies to initially asses the product usage and to check the benefits. When you open SAP Analytics product page, there is an option to register for free trial or you can also check costing plan provided by SAP.
When you click on icon, Start your free 30-day trial, you need to provide your business email to start with and accept TnCs regarding contact details to be shared with SAP SE.
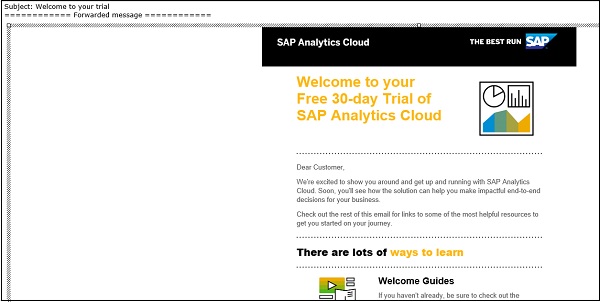
When you register on this link, you get an email to confirm your email ID. Post confirmation, SAP sends a welcome email on registered email address which provides you with quick guide for administration and setting up the environment.
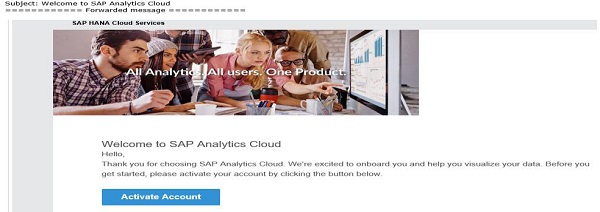
Welcome email from SAP Analytics Cloud team.
Sub − Welcome to your trial
Post this email, SAP sends one more email- Welcome to SAP Analytics Cloud to activate your account. Once you activate your account, you can land to home page of SAP Analytics Cloud tool.
Note
SAP Analytics Cloud is optimized for Google Chrome on Windows or macOS without touch support. Please keep in mind that some features may not work properly on other browsers or touch-enabled devices.
Activation link in the email is valid only for 7 days. If you want to activate your account after 7 days, use the Forgot password? link, and enter the email address that the welcome email was sent to.
If you didn't receive a welcome email, it could be because of your spam filtering. You can refer this knowledge base article for details − https://apps.support.sap.com/sap/support/knowledge/public/en/2527607
SAP Analytics Cloud - System Requirements
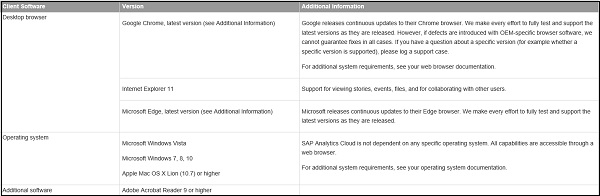
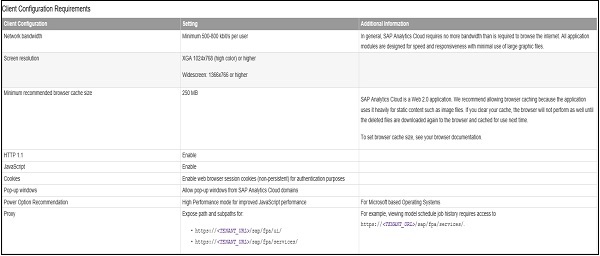
SAP Analytics cloud is web-based tool on HANA platform for Business Intelligence, planning and digital broad room. To access this tool, you need to have an internet connection, and some system requirements.
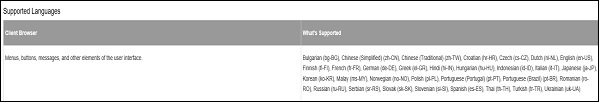
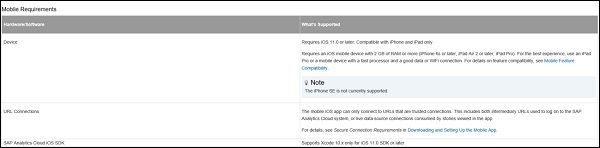
Below table lists client software requirement for this tool −
SAP Analytics Cloud - User Interface
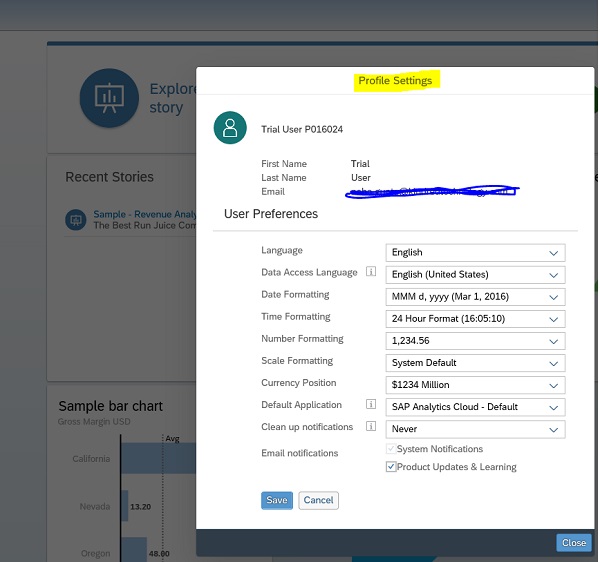
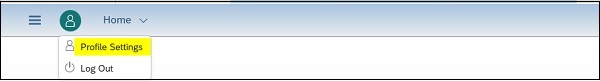
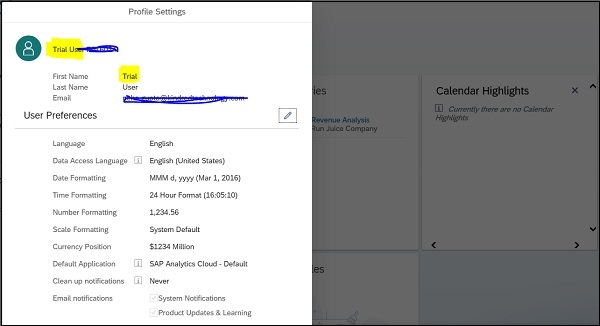
When you activate your account, you will land to home page of SAP Analytics screen. You can update your profile details be clicking on edit button under Profile settings. It shows you option to update these fields −
- Language
- Data Formatting
- Time Formatting
- Number Formatting
- Scale Formatting
- Currency position
- Default application
- Cleanup notifications
- Email notification settings
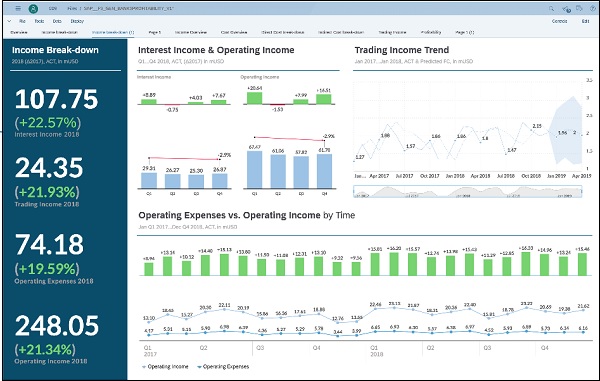
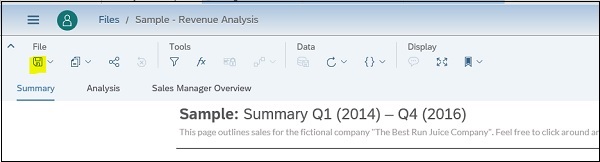
After that, go ahead and explore SAP Analytics cloud tool. You can try the sample story, to get an idea of what you'll be able to do using this tool. Below page shows you home screen of SAP Analytics Cloud −
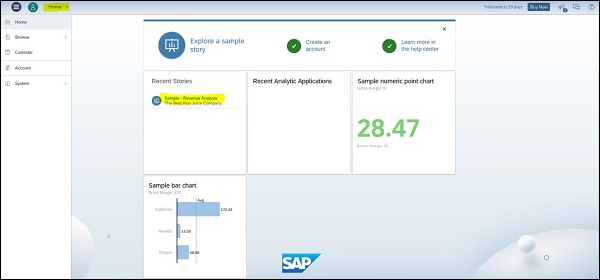
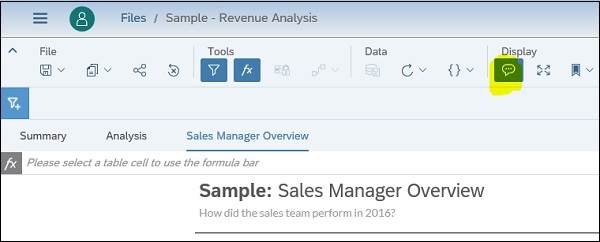
When you click on sample story, you will see 3 different panes and right side you have a control option to use different options under each pane.
- Summary
- Analysis
- Overview
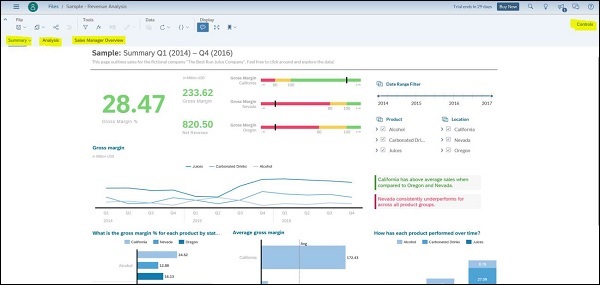
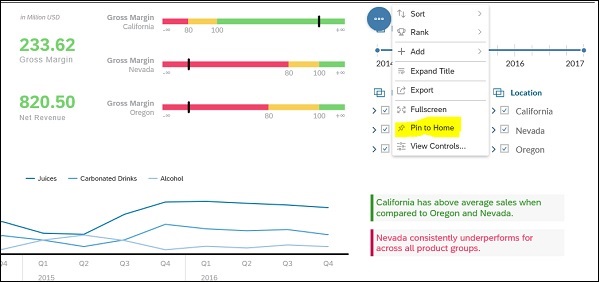
To use controls, select any of the object in Summary and click on Control button on top right corner. You can also use More Actions ... option at top of each object to see various options that can apply to any of visual.
Below options can be used to update the charts −
- Sort
- Rank
- Add Comment
- Expand Title
- Export
- FullScreen
- Pin to Home
- View Controls
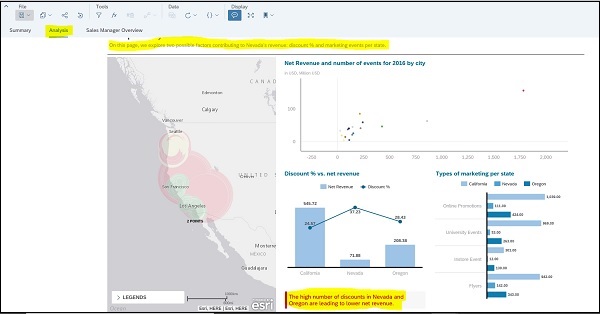
When you go to Analysis tab, it shows you the deep insight in Summary tab. It shows you the possible factors contributing to that visualization. You can also use More Actions ... option under Analysis to update results as per requirement.
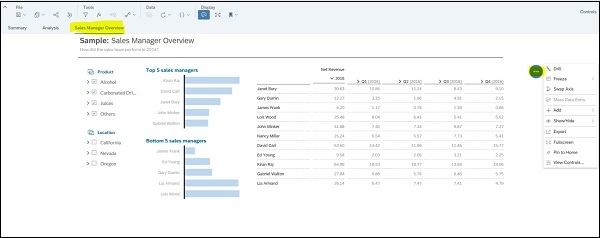
Sales Manager Overview
This tab shows you few top n and bottom n charts as per role. You can use More Actions ... option to further drill or explore this data.
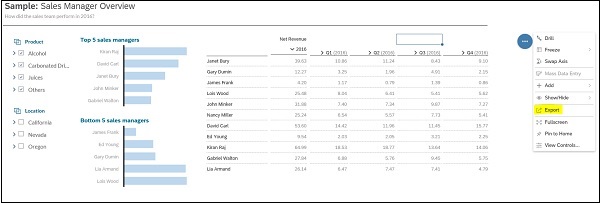
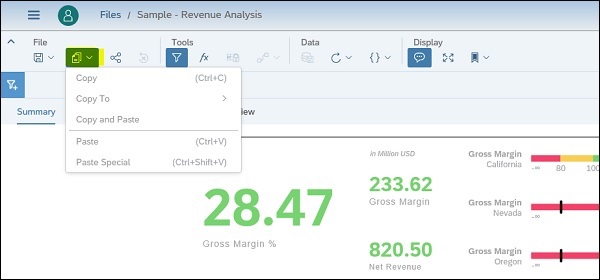
SAP Analytics Cloud - Export Options
Like other BI tools, SAP Analytics Cloud also provide you an option to export sample stories. You can use Save as option to save the complete story or can use export option for each chart to export data in CSV/XLS format.
To export, click on More Actions ... → Export.
In next pane, you have an option to select file type - CSV/XLS. You can also keep Number Formatting which includes Scaling, Units, and Currencies that were defined in the model.
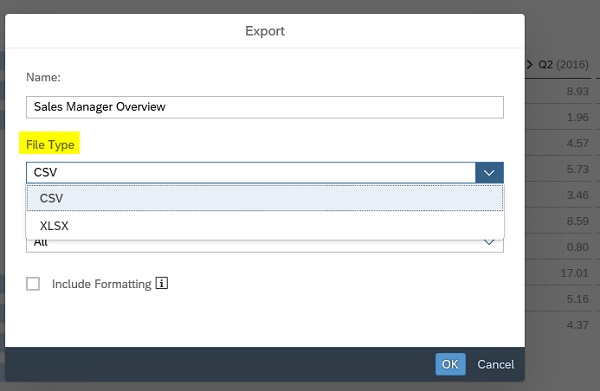
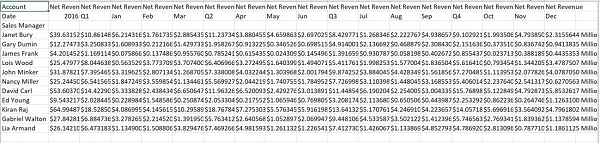
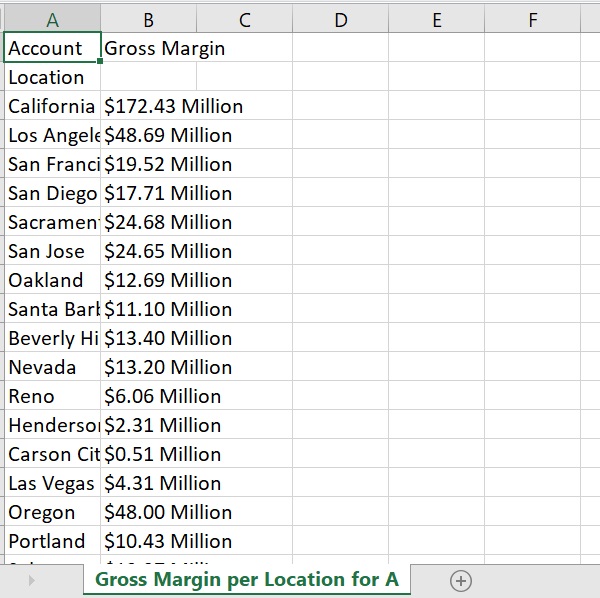
When you export a chart, it only exports the data in XLS format. Chart format is not appeared in exported report.
SAP Analytics Cloud - Creating First Story
Stories are main part of SAP Analytics to explore data and to find deep insight using charts and tables. You can share the stories with your colleagues, can also add comment on the findings. Stories has two main parts −
Data View
With use of data view, you can see real time data coming from source system and visualizations change accordingly.
Story View
With Story View, you can design beautiful, interactive dashboards for yourself or others. You can create new pages and add items such as charts, tables, and other graphics that visualize your data. Items on a page, such as a bar chart, are arranged as tiles that you can move around, resize, and style to your liking.
You can switch between Data and Story view. Whichever view of a story you are using, the key to the underlying data lies in the measures and dimensions defined in the model of your data. Measures represent quantities that provide meaning to your data. For example, sales revenue, salary, or number of employees. Dimensions represent categories that provide perspective on your data. Example: Product Category, date, or region.
To start with, you have to start with importing the data. From your computer, drag your file over to the Home screen in SAP Analytics Cloud. Release it on the Prepare Model option when the pop-up appears.
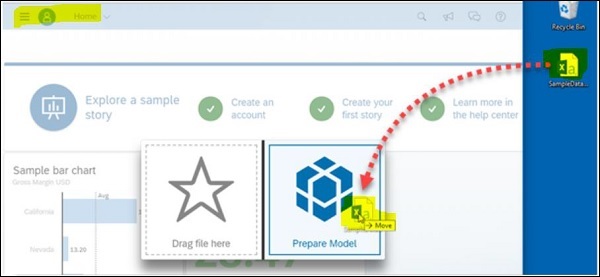
You can use - I'm Feeling Lucky automatically maps the column data to measures or dimensions, and dives right into the Data Exploration model. You can always change this model.
After the data is loaded into a model, you'll see the Data Manipulation view in your newly created story. Your column data has automatically been mapped to measures and dimensions. You can also select option - Enable date drill down checkbox to create date hierarchy. This allows you to view your data in a time-series chart.
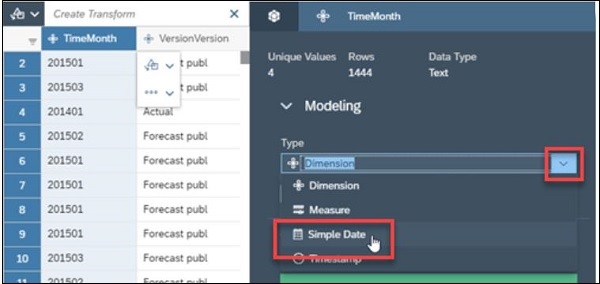
You can save changes by selecting save button to generate the model in the story with your data.
SAP Analytics Cloud - Exploring Data (Charts)
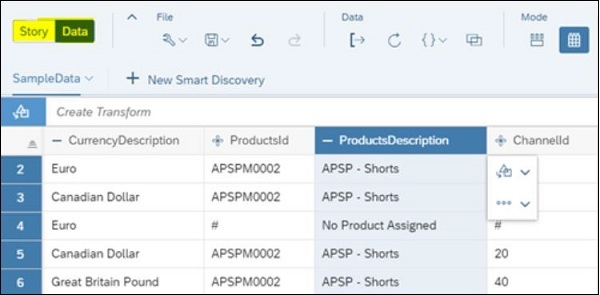
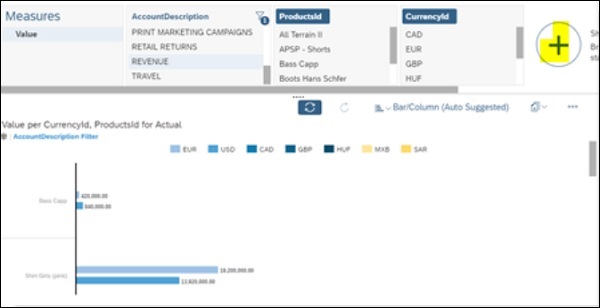
You can also explore your data in chart format in a story. To start with data exploration, select Data Exploration option from Mode section of tool bar. In Data view, SAP Analytics cloud auto suggests the charts when you select measures and dimensions.
To bring more dimensions, you can use Show dimension (+) from your dataset. In the Mode section of the toolbar, you can show or hide dimensions from Show or Hide Dimensions menu.
In SAP Analytics Cloud, you have Data view to get quick insights into your data, but it also provides a robust designer where you can build more permanent pages with visualizations and other interactive elements.
To get started, select Copy option to copy your existing chart on the Data view to the first page of your story. This will change data view automatically to the Story view.
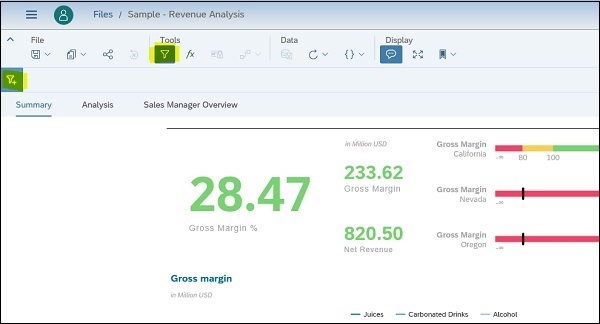
SAP Analytics Cloud - Using Filters
The Canvas provides a variety of tools that let you control how the charts on your page behave and are displayed. This allows you to show specific data and provide user with options to select values to display metrics. Like other tools, you can also apply chart filters in SAP Analytics Cloud on complete story, or to charts as well.
Add a Chart Filter
Filters let you focus on a specific set of data. You can apply filters to an entire story, a single page, or a specific chart on a page.
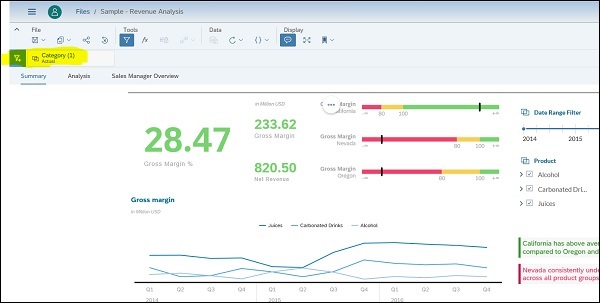
You can select Story Filter from the Tools section of the tool bar. And a filter bar appears under the toolbar.
In the next step, you have to click on Filter sign and select the Dimension value from drop down list to add to filter. A dialog will appear allowing you to set a filter on selected dimension.
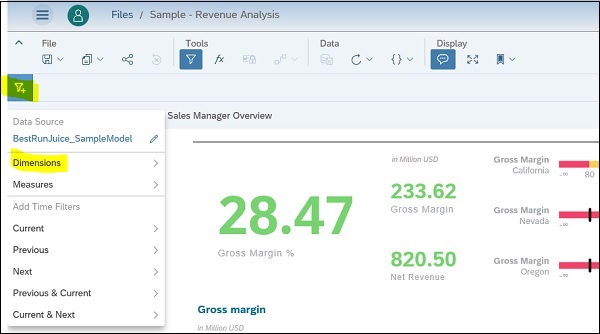
It shows you all the options that can be selected for that dimension under Filter options.
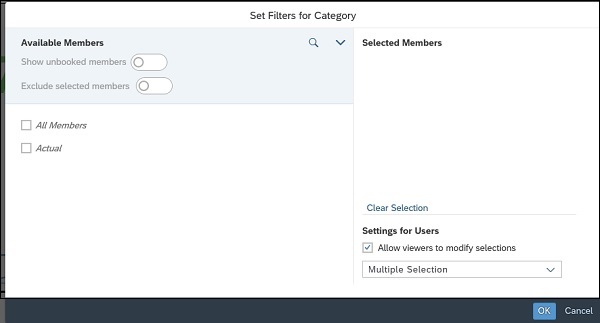
You also have an option to allow viewers to change/modify the filter selection. You can select check box - Allow Viewers to modify selections to enable this.
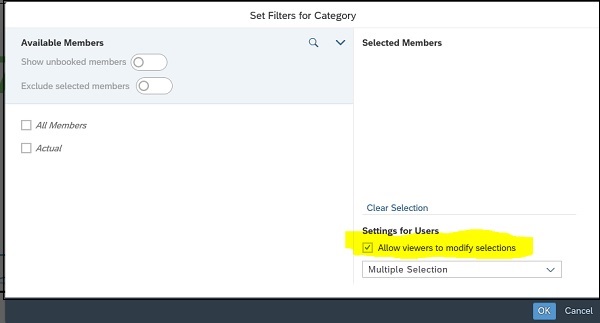
When you make the filter selection and click on OK button, your chart values are changed automatically, and selected filter will be shown in Tool bar.
SAP Analytics Cloud - Styling Template
The Styling panel on the Canvas allows you to change the fonts, colors, and other styling attributes of tiles on your page. You can also make use of pre-configured style templates.
From the Designer panel, select Styling option to switch from the Builder panel to the Styling panel. In the Table Properties area, select Report-Styling from the Templates drop-down list. Choose OK when prompted by the dialog.
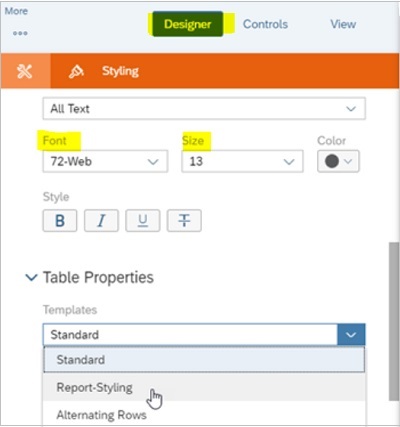
You can also change individual fonts and other styling options such as size, color, templates, etc., using this option.
SAP Analytics Cloud - Using Sharing Option
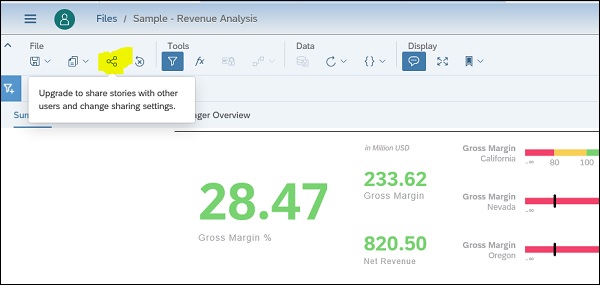
You can also save or share your Story with other team members. SAP Analytics Cloud provides you this option where you can share your story with your colleagues and other users.
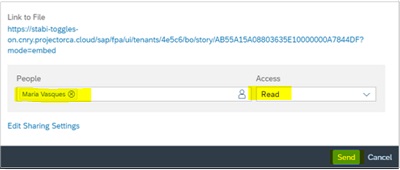
Sharing option is not available in 30-day free trial version. In other versions to share a story, use share option as highlighted below −
In the Share Story dialog, select (Add Usernames) and select a colleague's username and set the access value to Read and click on Send button.
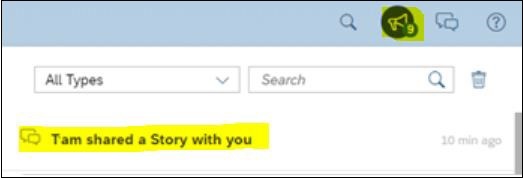
When your colleague logs on to SAP Analytics Cloud, they will see a notification containing a link to open your story and see what has been created.
SAP Analytics Cloud - Bookmarks
You can also pin individual story tiles to your Home screen. Pin different story tiles to create a dashboard of important charts and other visualizations that you can view immediately after signing into SAP Analytics Cloud.
Select the chart tile on the page so it is highlighted and go to More Actions (...).
You can resize and reposition the chart on the Home screen as you would on the story Canvas.
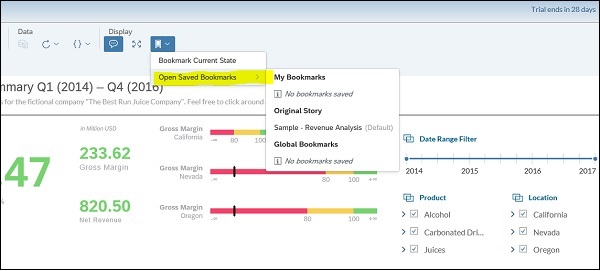
Using Bookmark option, you can use below option −
- Bookmark current state
- Open Saved Bookmark
When you use bookmark current state, it only includes filters, input controls, prompts, explorer views, and variances.
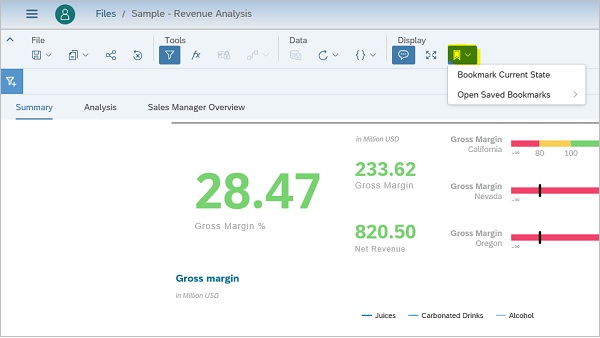
While using open saved bookmarks, you have the below options −
- My Bookmarks
- Original Story
- Global Bookmarks
SAP Analytics Cloud - Role Configuration
As a user of SAP Analytics Cloud, you can also request additional roles in the system. This option is not available in Trial account.
To request additional roles, you need to login with user name and initial password you received from your system administrator.
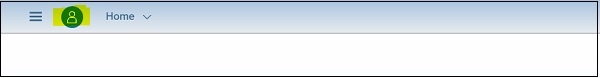
Select your user profile photo in the top bar (which may be the default image if you haven't uploaded a photo yet) and choose Request Roles.
In the next window, you can choose one of the following options −
To request standard roles that the administrator has defined, choose Default Roles and select the role you need.
To request individual roles, choose Self Service Roles and select the role you need.
It also provides you an option to add a comment, to explain why you need the selected role and then submit your request.
In the dialog, choose one of the following options −
To request standard roles that the administrator has defined, choose Default Roles and select the role you need. You can also request individual roles → choose Self Service Roles and select the role you need.
To check user type, you can check the details under Profile settings. For trial user, it shows your Trial user account # and business email.
Note
You cannot request roles while using a trial account of SAP Analytics Cloud.
SAP Analytics Cloud - Customizing Home Screen
While logging to SAP Analytics Cloud, it lands to home page of your account. Your Home screen is a place where you can access your recent stories and visualizations as tiles. You can also add useful reminders such as personal notes.
When you start SAP Analytics Cloud, the Home screen displays tile-like widgets to help you get started working on your analytics tasks.
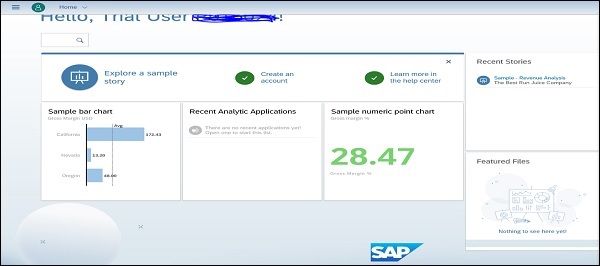
You have the following options on Home screen −
Explore a Sample Story
In SAP Analytics Cloud, you have an option to explore a sample feature-rich story to help familiarize you with key SAP Analytics Cloud capabilities.
Create an Account
You can use this option to access your profile settings including contact details, language preference, and a display name.
Create Your First Story
This option can be used to start creating a new story.
Learn More in the Help Center
You can access the SAP Analytics Cloud help topics, release notes, and instructional videos.
Features Files & Recent Stories
You can also display on the Home screen tiles for Featured Files, Recent Stories, and Recent Presentations. The Recent Stories tile displays five most recent stories you have viewed.
The Recent Presentations tile displays the five most recent SAP Digital Boardroom dashboards and agenda you have viewed.
SAP Analytics Cloud - Designer
With the use of Analytics designer, you can create applications for analyzing data and planning. SAP Analytics designer is available in all costing plans with read access.
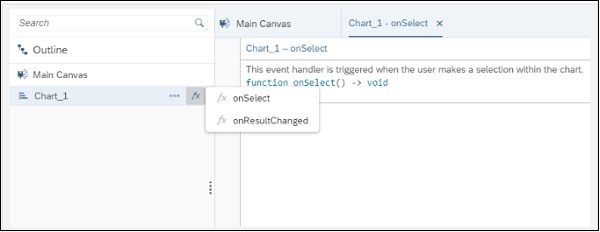
The major difference compared to stories is that in analytic applications, you can configure the behavior of the UI elements with a set of specific script API events and specify which actions should take place when events are triggered. This flexibility lets you create a variety of analytic applications, ranging from simple static dashboards to highly customized analytic applications with numerous options to browse and navigate data.
The main difference between an analytics application and stories is that analytics applications can use widgets and can be customized using scripting however it is not available in case of stories. In Analytics application, you can change the default behavior of the entire analytic application. The design environment will provide everything to create correct applications, but it does not guarantee that the application is correct or won't break.
For end users to consume analytics applications, they should have read permissions for analytics applications in their role.
The scripting language used in Analytics application is JavaScript. Scripts are executed by the Web browser without any transformation. You use the Web browser's script execution engine, which is available out of the box. In order to offer good tool support for application designers, you can add a type system on top and this can be used for validating script.
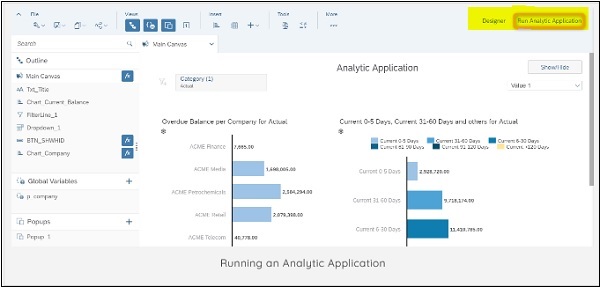
SAP Analytics Cloud - Application
Table-centric Data Visualization
The application is comprised of a table, which consumes a large extent of the available screen real estate. Around the table, typically above are many UI controls (buttons, checkboxes, dropdown boxes, and so on) to change the data display, such as to filter the data, change the data view, or show different dimensions. The nature of this application is that there is only one table, but many and potentially complex ways to show data differently.
Dashboard
The application is a dashboard visualizing a few data points with the help of tiles. There is no interactivity, but it gives users an overview of highly aggregated data. A typical option of some dashboards is to use the tiles for further drilling into details: clicking on a tile takes you to a more detailed page or an entirely new application showing more details for the aggregated number on the tile.
Generic Application
Many applications are created for a specific model. It means that UI, the widgets, and the logic are done with knowledge of the model and its available dimensions, members, and so on. Another category is generic applications. These are applications which need to be provided with a model whenever the application is executed. These applications are more complex to create as their logic needs to work with whatever model the end user selects at runtime. The advantage is that customers don't need to create applications for each and every model they have maintained in their system.
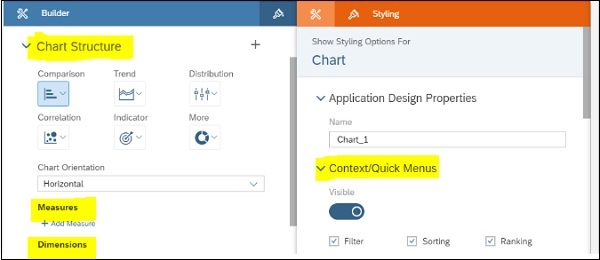
You can configure below chart properties in an Analytics application −
- Comparison
- Trend
- Distribution
- Correlation
- Indicator
Note
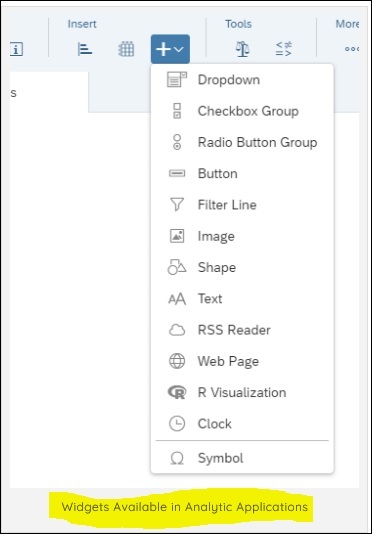
In Analytics designer, you have an option to use widgets like Button, Dropdown, Radio Button, Check Box and Filter Line and they are only available in Analytic Applications and not in the stories.
SAP Analytics Cloud - User Roles
You can also provide roles in SAP Analytics Cloud to grant permissions for working with Analytics application. SAP Analytics Cloud provide you with standard roles to create and manage analytics application in application designer. You can divide these roles based on different user permissions as per role assigned −
- To create, modify, delete an analytic application
- To view an analytics application
| Role | Description |
|---|---|
|
System Owner Admin BI Admin Application Creator |
Includes all authorizations that are required to create, view, update or delete analytic applications. |
|
BI Content Creator BI Content Viewer Viewer Modeler Planner Reporter |
Includes all authorizations that are required to view analytic applications. |
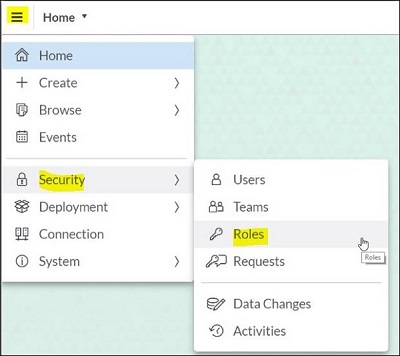
To grant permissions to any user, navigate to Main Menu → Security → Roles.
Select the role you want to enhance with the analytics designer capability or create a new role by clicking (Add Role).
Under Permissions, go to the Analytic Applications row and select the required permissions for this role. Following permissions can be assigned −
| Sr.No | Option & Description |
|---|---|
| 1 |
Create Users assigned to this role can create analytic applications. |
| 2 |
Read Users assigned to this role can view analytic applications and navigate the data. |
| 3 |
Update Users assigned to this role can change analytic applications. |
| 4 |
Delete Users assigned to this role can delete analytic applications. |
SAP Analytics Cloud - Assigning Roles
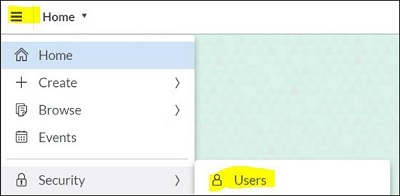
You can assign roles to users and teams in SAP Analytics Cloud. Go to Main Menu → Security → Users and find the required user. To assign a role to user, select the icon in Role column and it will display list of all available roles.
You can also assign a Concurrent user license to users by selecting the same option under Roles. You can assign a Concurrent Session License to multiple users and teams, but only a limited number of users can be logged on at a time as per license policy.
In case you dont define a role when creating or importing users, the default role will be assigned. Also you can set one or more roles as default roles that will be assigned to new users if users are created without a role assigned to them.
Note
Note that if no default role is defined in system, it assigns minimum permissions to a SAP Analytics Cloud user. That user can log in to application and request a role itself.
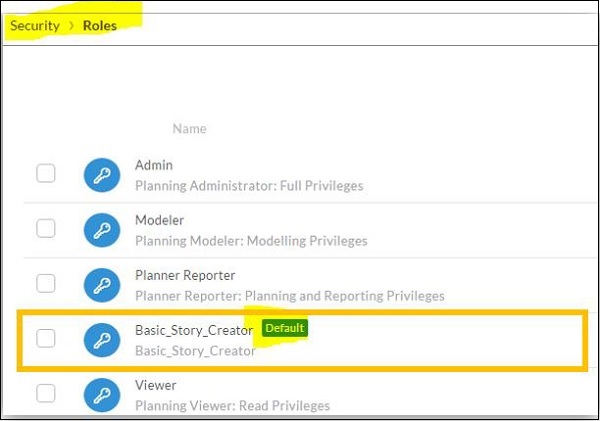
To assign a role as default role, navigate to Roles page under Security area and select an existing role → Settings and Select Use as Default Role → OK
SAP Analytics Cloud - Creating Teams
Like other BI tools, you can also create user groups for distribution of reports and analytic applications. You can use Teams for sharing the stories or files in the system. For example, you can share a story with all members of a team without having to assign users one by one.
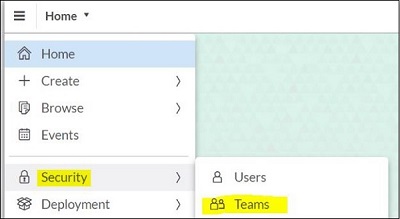
To create a Team, you have to navigate to Security area → Teams.
Enter the Team Name and you can enter the following characters: uppercase and lowercase letters, numbers, underscores, hash marks, and ampersands. Spaces are not allowed in the team name. The maximum length is 127 characters.
You can also provide a Description → Select Create Team Folder to add a folder for team files under the System folder. Members of your team automatically have full access to this folder however, they cannot delete or export it.
SAP Analytics Cloud - Admin for Support
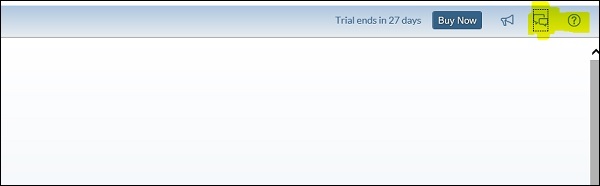
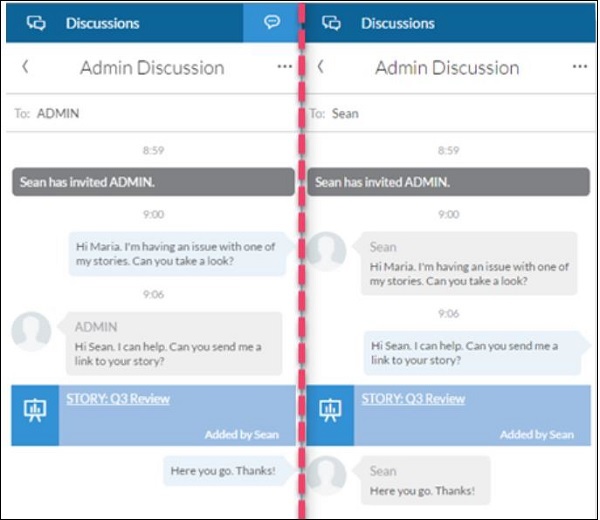
You can also configure admin support who can help you to fix any issues that you are not able to solve on your own. At home page of SAP Analytic Cloud application, you have to select Help (?) from the main toolbar and choose Contact Admin.
Next step to select the administrator you want to start a discussion with and select OK.
The discussion panel opens to a new discussion with your administrator. An invitation to the discussion is sent to their notifications where they can join the discussion and follow up with your issue.
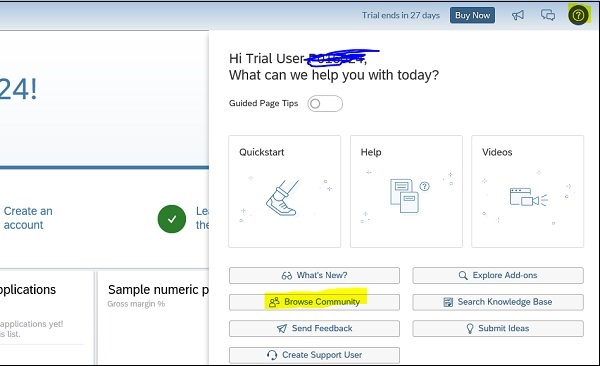
You can also navigate to SAP Analytics Cloud community via Help page → Browse Community. You can post or search for any common issues you are facing.
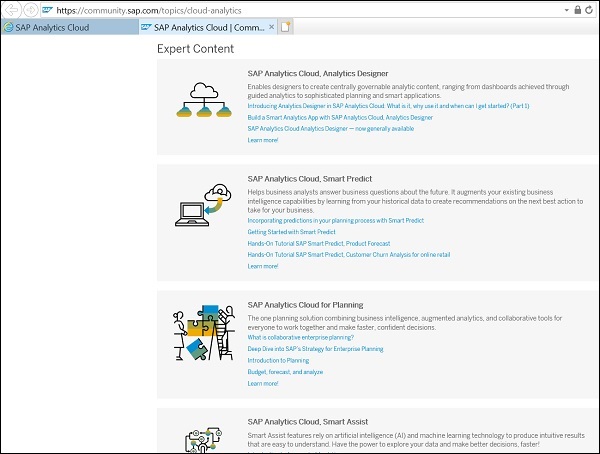
This is the direct link for SAP Analytics community page, https://pages.community.sap.com/topics/cloud-analytics.
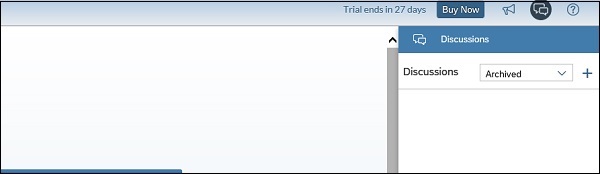
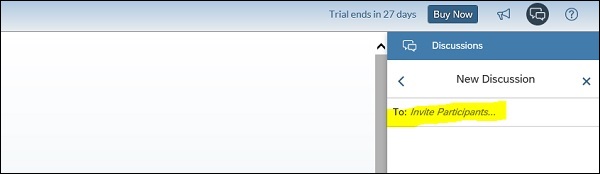
You can use Collaboration option to see the list of discussions that you have been invited to. You can start a new discussion at any time by choosing (New Discussion) and inviting specific participants. Only people who have been invited can see the discussion.
SAP Analytics Cloud - Adding Comments
In SAP Analytics Cloud, you can add a comment to a specific page or widget within a story and other users can reply or like your comment. To add a comment to a story page, on the page tab bar, select the Drop-down menu → Comment → Place Comment → Enter the comment in the displayed box.
Comments are not saved when you perform below functions −
- When you copy of a story − the copy will not contain any comments.
- While using Save As option to create a new story, comments will not be saved in new file.
- When you duplicate a widget or a story page.
- When you use export option to export a story to PDF.
- In digital boardroom, story comments cannot be viewed or added.
SAP Analytics Cloud - Digital Boardroom
Digital boardroom is a pace provided to create real time presentations for executive presentations. To use this feature, you must have one user license of the BI User, Predictive, Planning Standard, or Planning Professional type.
Role Required
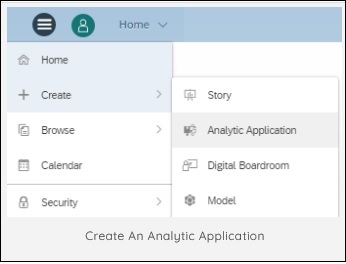
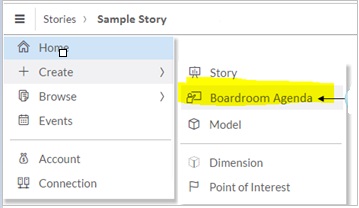
Boardroom Viewer or Boardroom Creator role by your administrator. To create new agendas in digital boardroom, you must navigate to Main Menu → Create (+) → Digital Boardroom. It will display 2 options − choose agenda or choose dashboard.
You need to provide a title, presenter name, and time for the first agenda item. Click the Design and open Build tab as shown below −
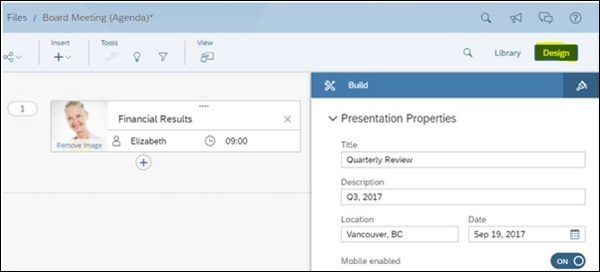
You have to provide the below information for agenda −
- Provide a title
- Description
- Location
- Date for the presentation properties
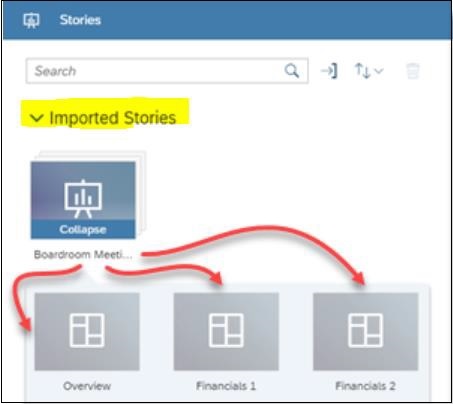
The content for your agenda comes from story pages containing the visualizations and data you want to present. To import a story, navigate to Library → open Stories panel and select one/more stories to import.
Imported stories are arranged in page bundle as shown below. To save the agenda, click on save button.
SAP Analytics Cloud - Support
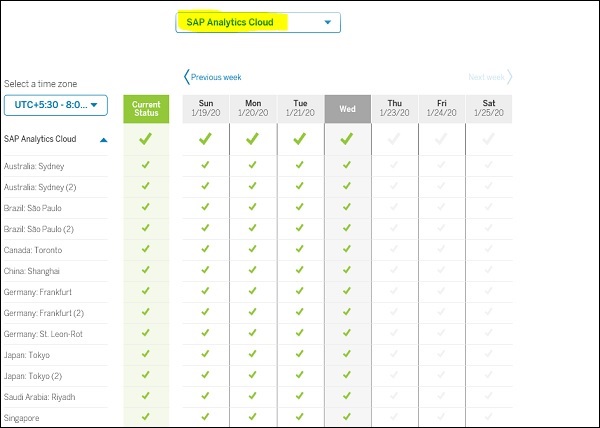
SAP also provides real time status and support for their cloud service. To get real-time status of service availability from the SAP Trust Center, you can use the following link −
www.sap.com/about/trust-center/cloud-service-status.html#sap-analytics-cloud
From drop down, you need to select SAP product and it shows you the status of cloud service in different regions.
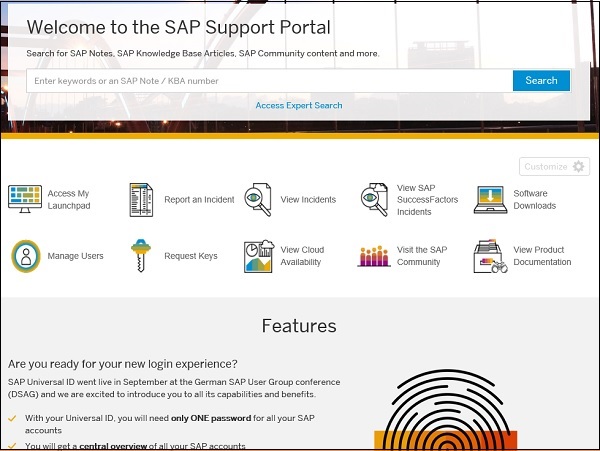
SAP also provides an option to report an incident on the SAP Support Portal (S-user required to login) using the following components −
https://support.sap.com/en/index.html
| Sr.No | Components & Description |
|---|---|
| 1 |
LOD-ANA-BI-ADM Roles, security, monitoring, users/teams, authorizations, permissions. |
| 2 |
LOD-ANA-BI-AUT User access errors including SSOSAML/IDP and login issues. |
| 3 |
LOD-ANA-BI-APP Analytics Designer and Data Analyzer |
| 4 |
LOD-ANA-BI-DES Analytic models including story design & visualizations, charts, etc. |
| 5 |
LOD-ANA-BI-IDC Import Data Connections (any supported data source type). |
| 6 |
LOD-ANA-BI-LDC Live Data Connections (excluding SAPBW and SAP BW/4HANA data sources). |
| 7 |
LOD-ANA-BI-BW Live Data Connections to SAP BW and SAP BW/4 HANA data sources. |
| 8 |
LOD-ANA-BR SAP Digital Boardroom |
| 9 |
LOD-ANA-PR Smart Predict, Smart Assist (Smart Discovery, Smart Insights), and predictive scenarios. |
| 10 |
LOD-ANA-HUB SAP Analytics Hub |
