- SAP Analytics Cloud - Home
- SAP Analytics Cloud - Introduction
- SAP Analytics Cloud - Registration (Trial)
- SAP Analytics Cloud - System Requirements
- SAP Analytics Cloud - User Interface
- SAP Analytics Cloud - Export Options
- SAP Analytics Cloud - Creating First Story
- SAP Analytics Cloud - Exploring Data (Charts)
- SAP Analytics Cloud - Using Filters
- SAP Analytics Cloud - Styling Template
- SAP Analytics Cloud - Using Sharing Option
- SAP Analytics Cloud - Bookmarks
- SAP Analytics Cloud - Role Configuration
- Customizing Home Screen
- SAP Analytics Cloud - Designer
- SAP Analytics Cloud - Application
- SAP Analytics Cloud - User Roles
- SAP Analytics Cloud - Assigning Roles
- SAP Analytics Cloud - Creating Teams
- SAP Analytics Cloud - Admin for Support
- SAP Analytics Cloud - Adding Comments
- SAP Analytics Cloud - Digital Boardroom
- SAP Analytics Cloud - Support
- SAP Analytics Cloud Resources
- SAP Analytics Cloud - Quick Guide
- SAP Analytics Cloud - Useful Resources
- SAP Analytics Cloud - Discussion
SAP Analytics Cloud - Exploring Data (Charts)
You can also explore your data in chart format in a story. To start with data exploration, select Data Exploration option from Mode section of tool bar. In Data view, SAP Analytics cloud auto suggests the charts when you select measures and dimensions.
To bring more dimensions, you can use Show dimension (+) from your dataset. In the Mode section of the toolbar, you can show or hide dimensions from Show or Hide Dimensions menu.
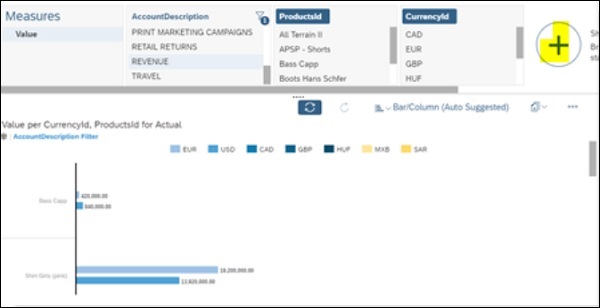
In SAP Analytics Cloud, you have Data view to get quick insights into your data, but it also provides a robust designer where you can build more permanent pages with visualizations and other interactive elements.
To get started, select Copy option to copy your existing chart on the Data view to the first page of your story. This will change data view automatically to the Story view.