- SAP Analytics Cloud - Home
- SAP Analytics Cloud - Introduction
- SAP Analytics Cloud - Registration (Trial)
- SAP Analytics Cloud - System Requirements
- SAP Analytics Cloud - User Interface
- SAP Analytics Cloud - Export Options
- SAP Analytics Cloud - Creating First Story
- SAP Analytics Cloud - Exploring Data (Charts)
- SAP Analytics Cloud - Using Filters
- SAP Analytics Cloud - Styling Template
- SAP Analytics Cloud - Using Sharing Option
- SAP Analytics Cloud - Bookmarks
- SAP Analytics Cloud - Role Configuration
- Customizing Home Screen
- SAP Analytics Cloud - Designer
- SAP Analytics Cloud - Application
- SAP Analytics Cloud - User Roles
- SAP Analytics Cloud - Assigning Roles
- SAP Analytics Cloud - Creating Teams
- SAP Analytics Cloud - Admin for Support
- SAP Analytics Cloud - Adding Comments
- SAP Analytics Cloud - Digital Boardroom
- SAP Analytics Cloud - Support
- SAP Analytics Cloud Resources
- SAP Analytics Cloud - Quick Guide
- SAP Analytics Cloud - Useful Resources
- SAP Analytics Cloud - Discussion
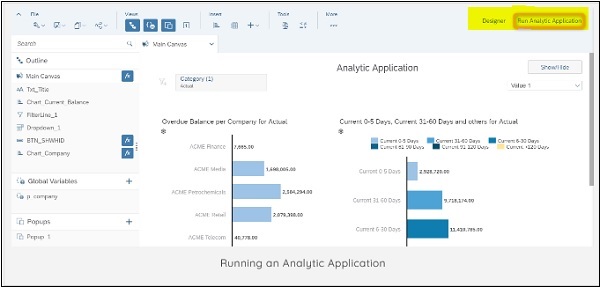
SAP Analytics Cloud - Application
Table-centric Data Visualization
The application is comprised of a table, which consumes a large extent of the available screen real estate. Around the table, typically above are many UI controls (buttons, checkboxes, dropdown boxes, and so on) to change the data display, such as to filter the data, change the data view, or show different dimensions. The nature of this application is that there is only one table, but many and potentially complex ways to show data differently.
Dashboard
The application is a dashboard visualizing a few data points with the help of tiles. There is no interactivity, but it gives users an overview of highly aggregated data. A typical option of some dashboards is to use the tiles for further drilling into details: clicking on a tile takes you to a more detailed page or an entirely new application showing more details for the aggregated number on the tile.
Generic Application
Many applications are created for a specific model. It means that UI, the widgets, and the logic are done with knowledge of the model and its available dimensions, members, and so on. Another category is generic applications. These are applications which need to be provided with a model whenever the application is executed. These applications are more complex to create as their logic needs to work with whatever model the end user selects at runtime. The advantage is that customers don't need to create applications for each and every model they have maintained in their system.
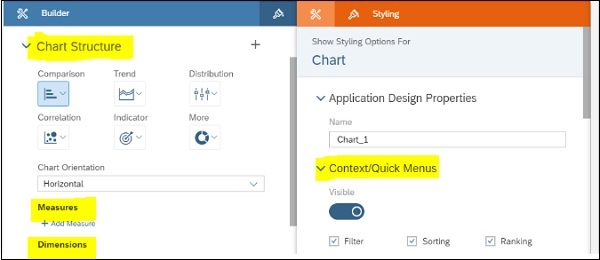
You can configure below chart properties in an Analytics application −
- Comparison
- Trend
- Distribution
- Correlation
- Indicator
Note
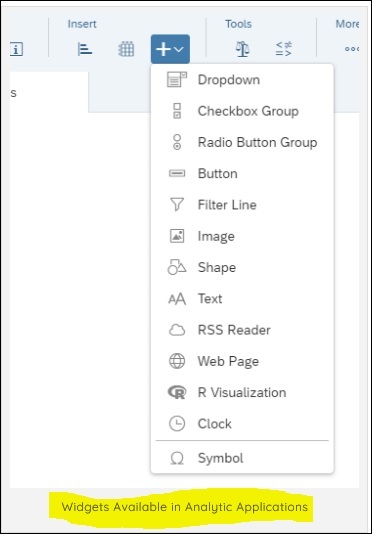
In Analytics designer, you have an option to use widgets like Button, Dropdown, Radio Button, Check Box and Filter Line and they are only available in Analytic Applications and not in the stories.