 Data Structure
 Networking
 RDBMS
RDBMS Operating System
 Java
Java MS Excel
 iOS
iOS HTML
HTML CSS
CSS Android
 Python
 C Programming
 C++
C++ C#
C# MongoDB
 MySQL
MySQL Javascript
 PHP
PHP
- Selected Reading
- UPSC IAS Exams Notes
- Developer's Best Practices
- Questions and Answers
- Effective Resume Writing
- HR Interview Questions
- Computer Glossary
- Who is Who
Modelling the Newton Raphson Method in Python
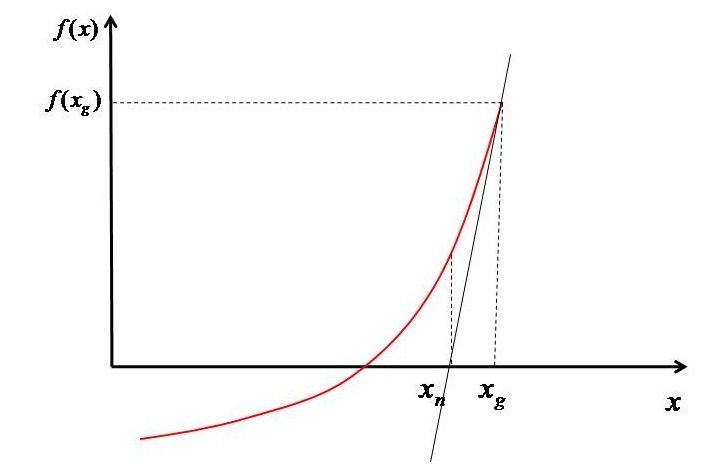
In this tutorial, I will show you how to evaluate the roots of a polynomial or transcendental equation with the help of a numerical method known as the Newton Raphson method. This is an iterative method in which we start with a initial guess (of independent variable) and then evaluate the new value of ? based on the guess. And the process goes on till the convergence is achieved. The method is explained with the help of a diagram as shown below.

Based on $x_{g}$ the value of function $(f^{'} \left ( x_{g} \right ))$ is evaluated. Then a tangent is drawn at the point such that it intersect the ?-axis at $x_{n}$. Now we have two points $(x_{g},f\left ( x_{g} \right ))$ and $(x_{n} ,0)$ in hand. The slope of the line which passes through these point can be written as shown in Equation-1.
$$\mathrm{f^{'} \left ( x_{g} \right )=\frac{0-f\left ( x_{g} \right )}{x_{n}-x_{g}}}$$
Therefore, the $x_{n}$can be evaluated as ?
$$\mathrm{x_{n}-x_{_{g}}=-\frac{f\left ( x_{g} \right )}{f^{'}\left ( x_{g} \right )}}$$
$$\mathrm{x_{n}=x_{_{g}}-\frac{f\left ( x_{g} \right )}{f^{'}\left ( x_{g} \right )}}$$
Now this new value of x will act as the guess for the next step. Based on this new guess the value of function is again evaluated and again the slope is evaluated and the procedure is repeated until the root is obtained $(i.e\left | x_{g} -x_{n}\right |<10^{-5})$.
The method is very fast but it can only give you one root at a time. To get another root you have to start with another guess and repeat the procedure once again.
Python Implementation of the Newton Raphson Method
Let's say we want to find the roots of Equation $x^{2}+4x+3=0$. The Python implementation of Newton Raphson method is as follows ?
Import the Packages ?
from pylab import *
Only one module, i.e., pylab has been used as it has numpy in it. So, no need to import it separately.
Form the Polynomial and its derivative functions viz. ?(?) and ?'(x).
f=lambda x: x**2+4*x+3
dfdx=lambda x: 2*x+4
I have used 'lambda' as there is only one statement in the function. If you want, then you can use 'def' methodology as well.
Create an array for "x" using the "linspace" function.
# Array of x
x=linspace(-15,10,50)
Now, this step is optional. Plot the function considering appropriate domain. I will also show you how to draw tangents and at the same time how the solution is converging. So if you are interested in the visual effects then you can follow this step.
# Plotting the function
figure(1,dpi=150)
plot(x,f(x))
plot([-15,10],[0,0],'k--')
xlabel('x')
ylabel('f(x)')
Assume an initial guess for ? to start the first iteration. Also set the error $(\left | x_{g}-x_{n} \right |)$ to some value which is more than the convergence criterion. In this article I have taken the convergence criterion as $<10^{-5}$, but you can set it based on the level of accuracy you require. Also set the loop counter to 1.
# Initial Guess
xg=10

# Setting initial error and loop counter
error=1
count=1
Within a "for" loop, solve the Equation (2) with the convergence criterion as mentioned above. Also, plot the error and the tangents. The tangent plotting is done in plot with the name figure(1) and the error in figure(2). Moreover, the $x_{g}$ and $f\left ( x_{g} \right )$ are also tabulated to show the different values.
# For printing x_g and f(x_g) at different steps
print(f"{'xg':^15}{'f(xg)':^15}")
print("===========================")

# Starting iterations
while error>1.E-5:
   # Solving Eq. 1
   xn=xg-f(xg)/dfdx(xg)

   # Printing x_g and f(x_g)
   print(f'{round(xg,5):^15}{round(f(xg),5):^15}')

   # Plotting tangents
   figure(1,dpi=300)
   plot([xg,xn],[f(xg),0])
   plot([xn,xn],[0,f(xn)],'--',label=f'xg={xg}')
   legend(bbox_to_anchor=(1.01, 1),loc='upper left', borderaxespad=0)

   # Evaluating error and plotting it
   error=abs(xn-xg)
   figure(2,dpi=300)
   semilogy(count,error,'ko')
   xlabel('Iteration count')
   ylabel('Error')

   # Setting up new value as guess for next step
   xg=xn

   # Incrementing the loop counter
   count=count+1
# printing the final answer
print("===========================")
print("\nRoot ",round(xn,5))
show()
After convergence, print the roots. And show the plots.
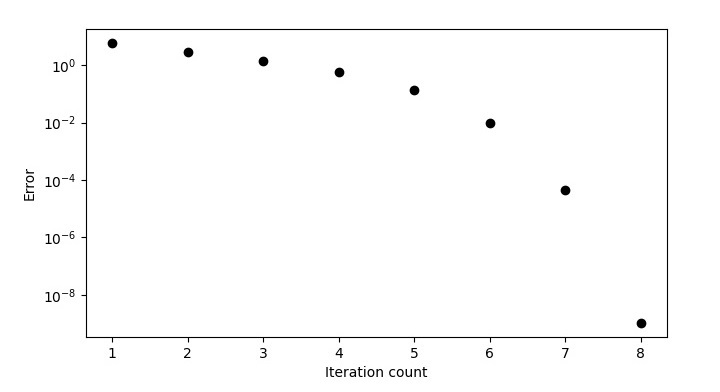
In the above case, I have taken the initial guess as 10. Therefore, the program output will be as follows ?
      xg                    f(xg)
======================================
      10                     143
    4.04167             35.50174
    1.10359              8.63228
    -0.2871               1.93403
   -0.85165              0.31871
   -0.99042              0.01926
   -0.99995               9e-05
     -1.0                    0.0
========================================
Root -1.0
The error plot is as follows ?

The function plot with tangents is shown in the figure given below.

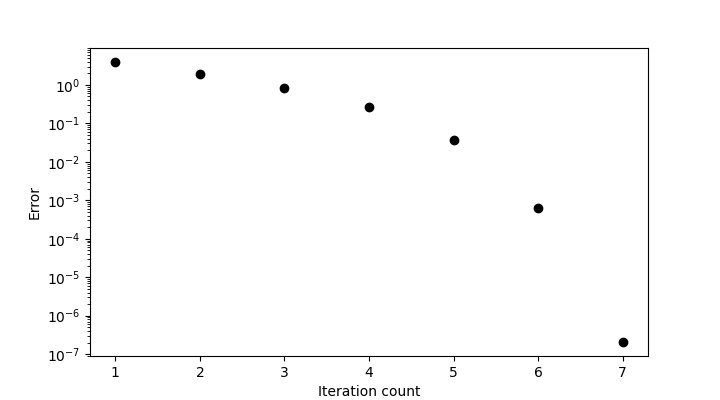
So corresponding to $x_{g}=10$ the root is ?1. For second root we have to change the guess, let's take it as ?10. Then the program output will be as follows ?
      xg          f(xg)
===========================
       -10          63
     -6.0625     15.50391
    -4.15433      3.64112
    -3.30925      0.71415
    -3.03652      0.07438
    -3.00064      0.00129
    -3.0            0.0
===========================
Root -3.0
Now, the error plot will be as follows ?

And the function plot will be like this ?

Therefore, corresponding to $x_{g}=-10$, the root is ?3.
Full Python Code
The full length code is as follows ?
# Importing module
from pylab import *

# Funciton for f(x) and f'(x)
f = lambda x: x ** 2 + 4 * x + 3
dfdx = lambda x: 2 * x + 4

# Array of x
x = linspace(-15, 10, 50)

# Plotting the function
figure(1, figsize=(7.20, 4.00))
plot(x, f(x))
plot([-15, 10], [0, 0], 'k--')
xlabel('x')
ylabel('f(x)')

# Initial Guess
xg = 10

# Setting initial error and loop counter
error = 1
count = 1

# For printing x_g and f(x_g) at different steps
print(f"{'xg':^15}{'f(xg)':^15}")
print("===========================")

# Starting iterations
while error > 1.E-5:
   # Solving Eq. 1
   xn = xg - f(xg) / dfdx(xg)

   # Printing x_g and f(x_g)
   print(f'{round(xg, 5):^15}{round(f(xg), 5):^15}')

   # Plotting tangents
   figure(1)
   plot([xg, xn], [f(xg), 0])
   plot([xn, xn], [0, f(xn)], '--', label=f'xg={xg}')
   legend(bbox_to_anchor=(0.4, 1.1), loc='upper left', borderaxespad=0)

   # Evaluating error and plotting it
   error = abs(xn - xg)
   figure(2, figsize=(7.20, 4.00))
   semilogy(count, error, 'ko')
   xlabel('Iteration count')
   ylabel('Error')

   # Settingup new value as guess for next step
   xg = xn

   # Incrementing the loop counter
   count = count + 1

# printing the final answer
print("===========================")
print("\nRoot ", round(xn, 5))
show()
You can copy the code directly into your Jupyter notebook and run it.
For Polynomial of your choice, you can change the function and derivative polynomial as shown in the above code and based on your guess value, you will get the output. For example, if you wanted to find the roots of ?3?sin2(?)??=0, then in the above code, the function and its derivatives will get changed to ?
# Function for f(x) and f'(x)
f=lambda x: x**3-(sin(x))**2-x
dfdx=lambda x: 3*x**2-2*sin(x)*cos(x)-1
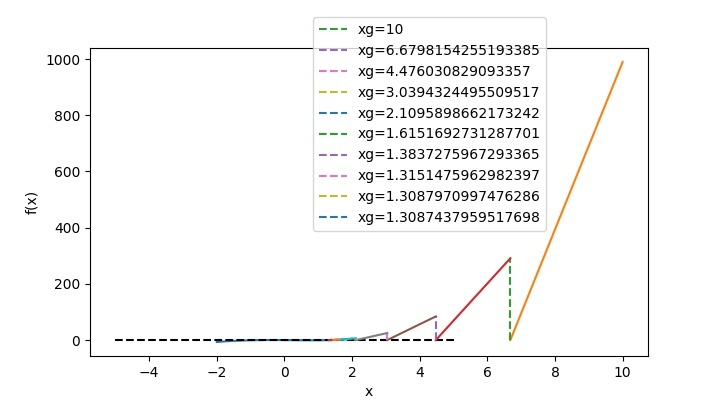
Then for a guess value of 1, the program output will be ?
       xg           f(xg)
===========================
        1          -0.70807
     1.64919        1.84246
     1.39734        0.36083
     1.31747        0.0321
     1.30884        0.00036
     1.30874          0.0
===========================
Root 1.30874
And, the function plot will look like this ?

Conclusion
In this tutorial, you have learnt how to solve the roots of an equation using the Newton Raphson method. You have also learned how to plot the tangents and show the root convergence in pyplots.

