 Data Structure
 Networking
 RDBMS
RDBMS Operating System
 Java
Java MS Excel
 iOS
iOS HTML
HTML CSS
CSS Android
 Python
 C Programming
 C++
C++ C#
C# MongoDB
 MySQL
MySQL Javascript
 PHP
PHP
- Selected Reading
- UPSC IAS Exams Notes
- Developer's Best Practices
- Questions and Answers
- Effective Resume Writing
- HR Interview Questions
- Computer Glossary
- Who is Who
Modelling the Rankine Cycle in Python
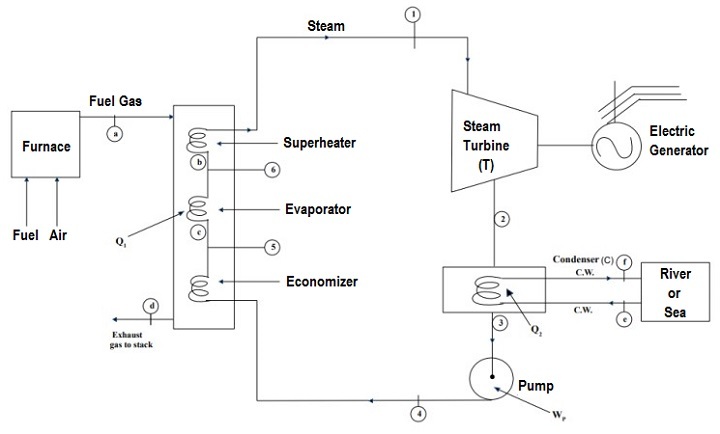
Rankine cycle is the heart of any thermal power plant. A basic Rankine cycle has four processes, viz. reversible adiabatic work interactions in turbine and pump and isobaric heat interactions in boiler and condenser.
A schematic of a thermal power plant is shown in the figure given below.

To increase the efficiency of a Rankine cycle Regeneration has been used i.e. bleeding steam to turbine and mixing it with feed water in feed water heater. Different processes in the cycle have to be modelled with the help of data from stream tables. Therefore, it becomes very essential to have data in the code itself.
To our rescue, the Pyromat module is there which is have steam data for both saturated and superheated states. Let us take an example to demonstrate the use of Pyromat and its capability to model the cycle.
Example 1
Consider a regenerative cycle using steam as the working fluid. Steam leaves the boiler and enters the turbine at 4 MPa, 400 °C. After expansion to 400 kPa, some of the steam is extracted from the turbine to heat the feedwater in an open FWH. The pressure in the FWH is 400 kPa, and the water leaving it is saturated liquid at 400 kPa. The steam not extracted expands to 10 kPa. Determine the cycle efficiency.
Solution
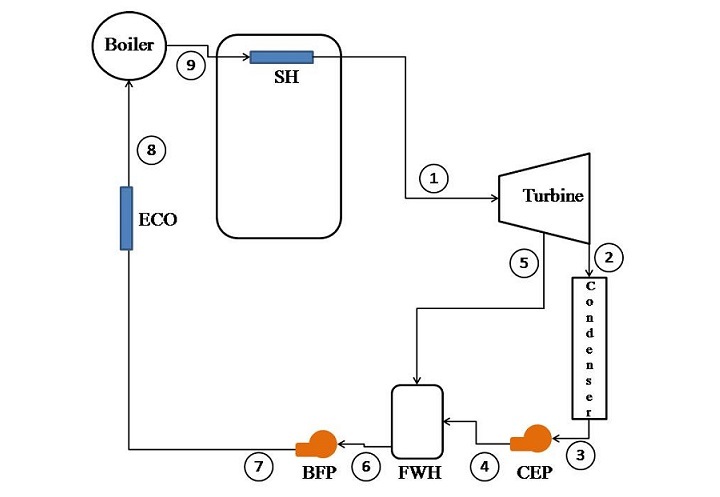
The process can be represented schematically as ?

Here,
SH ? Super heater
CEP ? Condensate extraction pump
FWH ? Feed water heater
BFP ? Boiler feed pump
ECO ? Economiser
SH ? Super heater
Python Program to Model the Rankine Cycle
The Python program to model it will be as follows ?
Example
# Importing the pyromat module
from pyromat import*

# configuring the pressure and fluid
config["unit_pressure"]="kPa"
prop_water=get('mp.H2O')

# Input data
# Boiler exit pressure and temperature
p1=4000
T1=400+273

# Economiser exit pressure
p8=p1

# Economiser inlet pressure
p7=p1

# Steam extraction pressure
p5=400

# Inlet pressure from BFP
p6=p5

# Exit pressure from CEP
p4=p5

# Condenser pressure
p2=10
p3=p2

# Boiler exit pressure
p9=p8

# Turbine
# POINT-1
h1=prop_water.h(p=p1,T=T1)
s1=prop_water.s(p=p1,T=T1)
s5=s1
s2=s1

# POINT-5
T5,x5=prop_water.T_s(p=p5,s=s5,quality='True')
h5=prop_water.h(p=p5,x=x5)

# POINT-2
T2,x2=prop_water.T_s(p=p2,s=s2,quality='True')
h2=prop_water.h(p=p2,x=x2)

# Condenser
# POINT-3
h3=prop_water.hs(p=p3)[0]
T3=prop_water.Ts(p=p3)
s3=prop_water.ss(p=p3)[0]

# CEP
v3=1/prop_water.ds(p=p3)[0]
w_cep=v3*(p4-p3)

# POINT-4
s4=s3
h4=h3+w_cep
T4=prop_water.T_s(s=s4,p=p4)

# FWH
# POINT-6
h6=prop_water.hs(p=p6)[0]
s6=prop_water.ss(p=p6)[0]
T6=prop_water.Ts(p=p6)
v6=1/prop_water.ds(p=p6)[0]

# BFP
# POINT-7
s7=s6
w_bfp=v6*(p7-p6)
h7=h6+w_bfp
T7=prop_water.T_s(s=s7,p=p7)

# POINT-8
h8=prop_water.hs(p=p8)[0]
s8=prop_water.ss(p=p8)[0]
T8=prop_water.Ts(p=p8)

# POINT-9
s9=prop_water.ss(p=p8)[1]
T9=T8

# Final Calculations

# Calculation of extracted mass
m=(h6-h4)/(h5-h4)
w_turbine=h1-h5+(1-m)*(h5-h2)
w_net=w_turbine-w_cep-w_bfp
q1=h1-h7
q2=(1-m)*(h2-h3)

# Method 1
efficiency=(w_net/q1)*100

# Method 2
e2=(1-q2/q1)*100

print('The efficiency of Rankine Cycle is: ',round(e2[0],2),'%')
print('The efficiency of Rankine Cycle is: ',round(efficiency[0],2),'%')
Output
When you execute this program, it will produce the following output ?
The efficiency of Rankine Cycle is: 37.46 %
The efficiency of Rankine Cycle is: 37.45 %
For knowing that temperatures and pressures are different points, the following code can be written?
from pandas import *
p=[p1,p2,p3,p4,p5,p6,p7,p8,p9]
T=[T1,T2,T3,T4,T5,T6,T7,T8,T9]
stage=list(range(1,10))
data={'stage':stage,'p':p,'T':T}
df=DataFrame(data)
print(df)
The output will be ?
    stage      p                     T
0       1   4000                   673
1       2     10  [318.95560780290276]
2       3     10  [318.95560780290276]
3       4    400    [318.968869853315]
4       5    400   [416.7588812509273]
5       6    400   [416.7588812509273]
6       7   4000   [417.1315355843229]
7       8   4000   [523.5036113863505]
8       9   4000   [523.5036113863505]
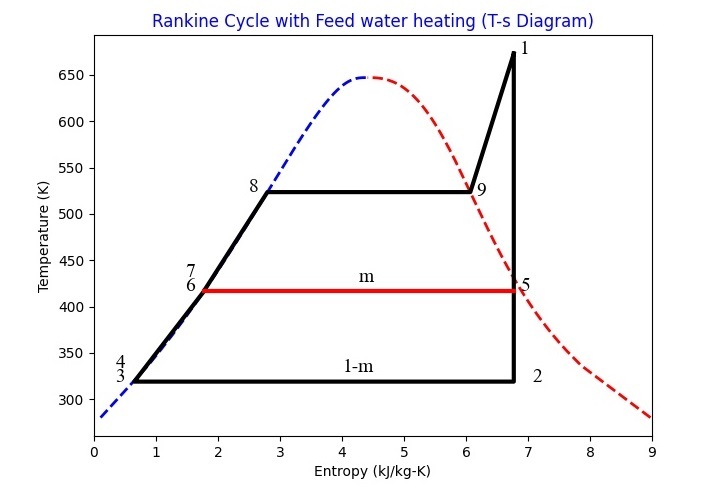
To plot the Rankine cycle, the following code can be used ?
# Importing modules
from pylab import *
from numpy import *

# Setting fonts
font = {'family':'Times New Roman', 'size': 14}
figure(figsize=(7.20, 5.20))
title('Rankine Cycle with Feed water heating (T-s Diagram)',color='b')
rc('font', **font)

# Drawing vapour dome

p=linspace(1,22064,1000)
T=prop_water.Ts(p=p)
s=prop_water.ss(p=p)
plot(s[0],T,'b--',linewidth=2)
plot(s[1],T,'r--',linewidth=2)

# connecting all states with lines
se=[s1,s5,s2,s3,s4,s6,s7,s8,s9,s1]
Te=[T1,T5,T2,T3,T4,T6,T7,T8,T9,T1]
plot(se,Te,'k',linewidth=3)
plot([s5,s6],[T5,T6],'r',linewidth=3)
xlim(0,9)

# Numbering the states
text(s1+0.1,T1,'1')
text(s5+0.1,T5,'5')
text(s2+0.3,T2,'2')
text(s3-0.3,T3,'3')
text(s4-0.3,T4+15,'4')
text(s6-0.3,T6,'6')
text(s7-0.3,T7+15,'7')
text(s8-0.3,T8,'8')
text(s9+0.1,T9-4,'9')
text((s5+s6)/2,(T5)+10,'m')
text((s3+s2)/2+0.3,(T3)+10,'1-m')
xlabel('Entropy (kJ/kg-K)')
ylabel('Temperature (K)')
savefig("Rankine.jpg")
show()
Therefore, the Rankine cycle plot from the above code will be as follows ?

Conclusion
In this short tutorial, the Rankine cycle has been modelled in the Python by using Pyromat module. Before using Pyromat, you should install it (for pip users: "pip install pyromat"). Properties at different points are evaluated and printed. Based on the property data, the Rankine cycle has been finally plotted.

