 Data Structure
 Networking
 RDBMS
RDBMS Operating System
 Java
Java MS Excel
 iOS
iOS HTML
HTML CSS
CSS Android
 Python
 C Programming
 C++
C++ C#
C# MongoDB
 MySQL
MySQL Javascript
 PHP
PHP
- Selected Reading
- UPSC IAS Exams Notes
- Developer's Best Practices
- Questions and Answers
- Effective Resume Writing
- HR Interview Questions
- Computer Glossary
- Who is Who
Modelling the Carnot Cycle in Python
Carnot cycle is the most fundamental gas power cycle. This is the cycle which acts as a benchmark for any engine cycle. Each and every engine cycle efficiency is checked against the Carnot Cycle. If an inventor develops a new engine cycle, then it has to be validated against the benchmark, i.e., the Carnot Cycle.
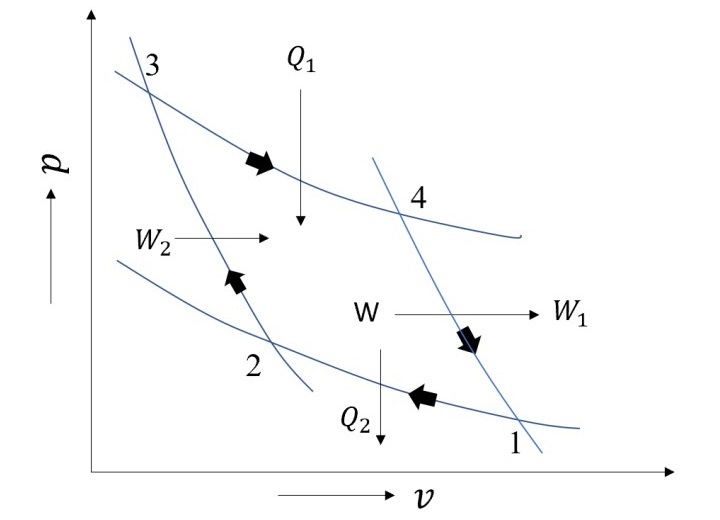
All thermodynamic cycle has an upper limit established by the Carnot cycle. It comprises of two reversible adiabatic processes and two isothermal processes, in total four processes. Isothermal processes involve the addition and rejection of heat, whereas reversible adiabatic processes involve work interactions. A Carnot cycle's schematic is shown in the Figure given below.

Heat rejection and addition occur isothermally in steps 1-2 and 3-4. Whereas processes 4-1 and 2-3 are reversible adiabatic processes that interact with the cycle through work from and into, respectively.
Maximum pressure ($\mathrm{p_{max}}$), minimum pressure ($\mathrm{p_{min}}$), maximum volume ($\mathrm{V_{max}}$), compression ratio (?), and adiabatic exponent (?) are the input variables taken into consideration when modelling the cycle. The thermodynamic calculations of several processes are explained below.
Process 1-2: (Isothermal Process)
Process 1-2 is an isothermal process. Here,
$$\mathrm{p_{1}\:=\:p_{min}}$$
$$\mathrm{v_{1}\:=\:v_{max}}$$
Using the compression ratio (r), the first volume at point 2 will be assessed in relation to the volume at point 1 as follows ?
$$\mathrm{v_{2}\:=\:\frac{v_{1}}{r}}$$
The isothermal constant during steps 1-2 is then calculated as follows ?
$$\mathrm{c_{1}\:=\:p_{1}\:\times\:v_{1}}$$
The pressure variation along the line 1-2 is assessed as follows once $\mathrm{c_{1}}$ is known ?
$$\mathrm{p\:=\:\frac{c_{1}}{v}}$$
Process 2-3 (Reversible Adiabatic Process)
Process 2-3 is a reversible adiabatic process. Here,
$$\mathrm{p_{3}\:=\:p_{max}}$$
Let $\mathrm{c_{2}}$ be the adiabatic line's constant. As the adiabatic and isothermal lines intersect at point 2, $\mathrm{c_{2}}$ can be calculated as
$$\mathrm{p_{2}\:=\:\frac{c_{2}}{v_{2}^{\gamma}}\:=\:\frac{c_{1}}{v_{2}}}$$
$$\mathrm{c_{2}\:=\:c_{1}\:\times\:v_{2}^{\gamma\:-\:1}}$$
The volume at point 3 can be calculated as follows because $\mathrm{c_{2}}$ also meets point 3 ?
$$\mathrm{v_{3}\:=\:\left ( \frac{c_{2}}{p_{3}} \right )^{\frac{1}{\gamma }}}$$
The pressure variation along 2-3 can be assessed as ?
$$\mathrm{p\:=\:\frac{c_{2}}{v^{\gamma}}}$$
Process 3-4 (Isothermal Process)
Let lines 3-4's constant be $\mathrm{c_{3}}$. Since $\mathrm{p_{3}}$ and $\mathrm{v_{3}}$ are both known and point 3 also passes through them, the constant along isothermal is calculated as follows ?
$$\mathrm{c_{3}\:=\:p_{3}\:\times\:v_{3}}$$
Moreover, one needs to be aware of the constant along 4-1 in order to assess pressure fluctuation along 3-4. Let's say it is $\mathrm{c_{4}}$, and since $\mathrm{c_{4}}$ also meets point 1, the evaluation is as follows ?
$$\mathrm{c_{4}\:=\:p_{1}\:\times\:v_{1}^{\gamma}}$$
Hence, $\mathrm{v_{4}}$ can be evaluated as ?
$$\mathrm{v_{4}\:=\:\left ( \frac{c_{4}}{c_{3}} \right )^{\frac{1}{\gamma\:-\:1 }}}$$
So, the pressure variation along 3-4 can be evaluated as ?
$$\mathrm{p\:=\:\frac{c_{3}}{v}}$$
Process 4-1 (Reversible Adiabatic)
Knowing $\mathrm{c_{4}}$ and the volumes at both 1 and 4, it is possible to calculate the pressure variation along 4-1 as follows ?
$$\mathrm{p\:=\:\frac{c_{4}}{v^{\gamma}}}$$
Python Code to Model a Carnot Cycle
The Python function which will model the Carnot cycle is as follows ?
from pylab import *
from pandas import *

# Carnot Cycle
def carnot(p_min,p_max,v_max,r,gma):
   font = {'family':'Times New Roman', 'size':16}
   figure(figsize=(7.50,5.50))
   rc('font', **font)
   '''This function prints the carnot cycle
   The arguments are as follows:
   p_min: minimum pressure
   p_max: Maximum pressure
   v_max: Maximum volume
   r: compression ratio
   gma: Adiabatic exponent
   The order of arguments is: p_min,p_max,v_max,r,gma'''
   p1=p_min
   v1=v_max
   v2=v1/r
   c1=p1*v1

   # Process 1-2
   v=linspace(v2,v1,100)
   p=c1/v
   plot(v,p/1000,'r-',linewidth=3)
   p2=c1/v2

   # Process 2-3
   p3=p_max
   c2=c1*v2**(gma-1.)
   v3=(c2/p3)**(1/gma)
   v=linspace(v3,v2,100)
   p=c2/v**gma
   plot(v,p/1000,'b',linewidth=3)

   # Process 3-4
   c3=p3*v3
   c4=p1*v1**gma
   v4=(c4/c3)**(1/(gma-1.))
   v=linspace(v3,v4,100)
   p=c3/v
   plot(v,p/1000,'g',linewidth=3)
   p4=c3/v4

   # Process 4-1
   v=linspace(v4,v1,100)
   p=c4/v**gma
   plot(v,p/1000,'c',linewidth=3)
   title('Carnot Cycle',size='large',color='k')
   xlabel('Volume ($m^3$)')
   ylabel('Pressure (kPa)')
   grid(linestyle='--', color='k')
   axis([0.,v_max+0.01,1*10**5/10**3,21*10**5/10**3])
   text(v1,p1/1000,'1')
   text(v2,p2/1000-200,'2')
   text(v3+0.01,p3/1000-20,'3')
   text(v4,p4/1000,'4')
   data={
      'p':[p1,p2,p3,p4],
      'v':[v1,v2,v3,v4],
      'c':[c1,c2,c3,c4],
      'State': [1,2,3,4]
   }
   df=DataFrame(data)
   savefig('Carnot_final.jpg')
   return df.set_index('State')
carnot(2*10**5,20*10**5,0.5,5,1.4)
show()
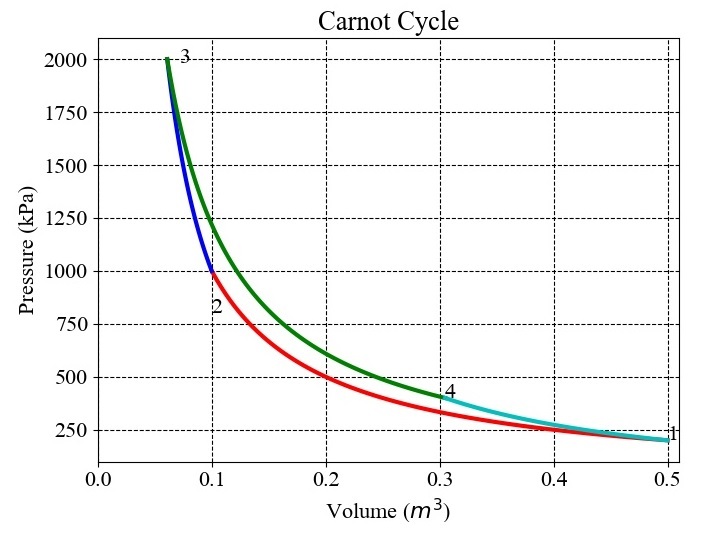
For $\mathrm{p_{min}\:=\:2\:\times\:10^{5}\:Pa}$, $\mathrm{p_{max}\:=\:20\:\times\:10^{5}\:Pa}$, $\mathrm{v_{max}\:=\:0.5\:m^{3}}$, $\mathrm{r\:=\:5}$, and $\mathrm{\gamma\:=\:1.4}$ the results obtained are shown in the Figure given below ?

The values of pressure, volumes at different state points are as follows ?
State |
p |
v |
|---|---|---|
1 |
200000.0 |
0.500000 |
2 |
1000000.0 |
0.100000 |
3 |
2000000.0 |
0.060951 |
4 |
400000.0 |
0.304753 |
Conclusion
In this tutorial, the methodology has been presented to model Carnot Cycle. A Python function has been presented and a test case has been taken to demonstrate the use of function. The function is capable to draw the cycle based on the input data.

