- ggplot2 - Home
- ggplot2 - Introduction
- ggplot2 - Installation of R
- ggplot2 - Default Plot in R
- ggplot2 - Working with Axes
- ggplot2 - Working with Legends
- ggplot2 - Scatter Plots & Jitter Plots
- ggplot2 - Bar Plots & Histograms
- ggplot2 - Pie Charts
- ggplot2 - Marginal Plots
- ggplot2 - Bubble Plots & Count Charts
- ggplot2 - Diverging Charts
- ggplot2 - Themes
- ggplot2 - Multi Panel Plots
- ggplot2 - Multiple Plots
- ggplot2 - Background Colors
- ggplot2 - Time Series
- ggplot2 Useful Resources
- ggplot2 - Quick Guide
- ggplot2 - Useful Resources
- ggplot2 - Discussion
ggplot2 - Default Plot in R
In this chapter, we will focus on creating a simple plot with the help of ggplot2. We will use following steps to create the default plot in R.
Inclusion of library and dataset in workspace
Include the library in R. Loading the package which is needed. Now we will focus on ggplot2 package.
# Load ggplot2
library(ggplot2)
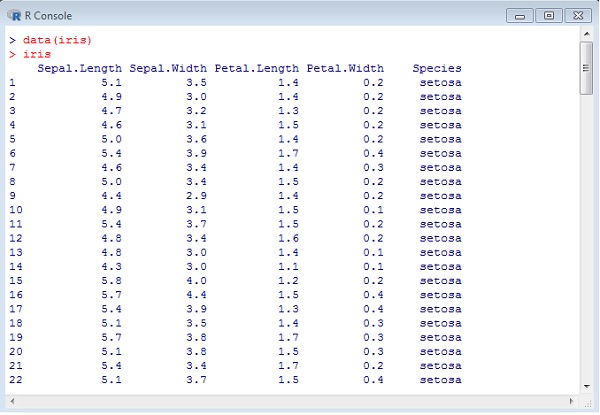
We will implement dataset namely Iris. The dataset contains 3 classes of 50 instances each, where each class refers to a type of iris plant. One class is linearly separable from the other two; the latter are NOT linearly separable from each other.
# Read in dataset
data(iris)
The list of attributes which is included in the dataset is given below −
Using attributes for sample plot
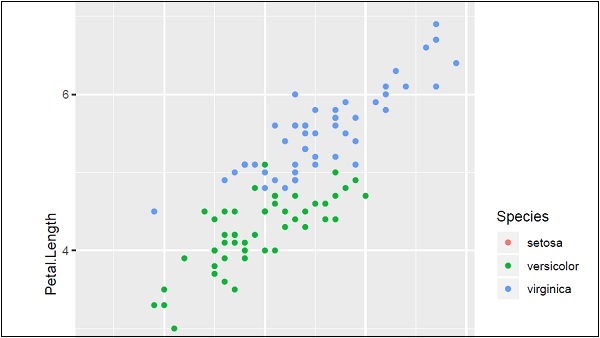
Plotting the iris dataset plot with ggplot2 in simpler manner involves the following syntax −
# Plot
IrisPlot <- ggplot(iris, aes(Sepal.Length, Petal.Length, colour=Species))
   + geom_point()
print(IrisPlot)
The first parameter takes the dataset as input, second parameter mentions the legend and attributes which need to be plotted in the database. In this example, we are using legend Species. Geom_point() implies scattered plot which will be discussed in later chapter in detail.
The output generated is mentioned below −
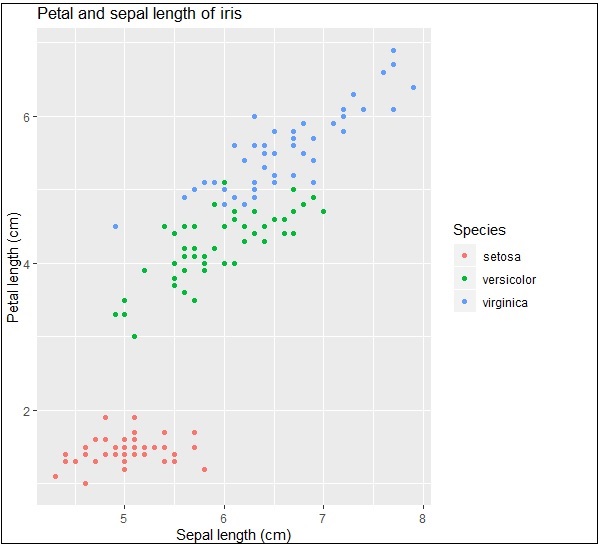
Here we can modify the title, x label and y label which means x axis and y axis labels in systematic format as given below −
print(IrisPlot + labs(y="Petal length (cm)", x = "Sepal length (cm)")
   + ggtitle("Petal and sepal length of iris"))