
Article Categories
- All Categories
-
 Data Structure
-
 Networking
-
 RDBMS
RDBMS
-
 Operating System
-
 Java
Java
-
 MS Excel
-
 iOS
iOS
-
 HTML
HTML
-
 CSS
CSS
-
 Android
-
 Python
-
 C Programming
-
 C++
C++
-
 C#
C#
-
 MongoDB
-
 MySQL
MySQL
-
 Javascript
-
 PHP
PHP
-
 Economics & Finance
Selected Reading
How to save a plot as SVG created with ggplot2 in R?
There are multiple ways to save a plot created in R. Base R provides, metafile, bitmap, and postscript options to copy and save the plots created in R but we can also save the plots created with ggplot2 as an SVG file with the help of svglite package. The ggsave function of svglite package does this job easily and we can also define the height and width of the plot inside this function.
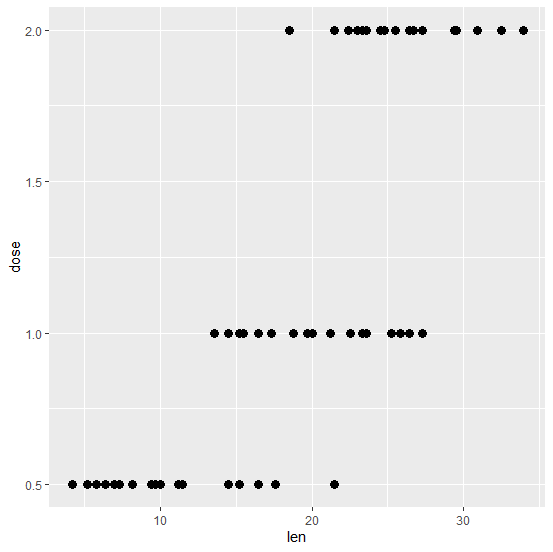
Example
head(ToothGrowth)
  len supp dose
1  4.2 VC  0.5
2 11.5 VC  0.5
3  7.3 VC  0.5
4  5.8 VC  0.5
5  6.4 VC  0.5
6 10.0 VC  0.5
library(ggplot2)
library(svglite)
ScatterPlotImage<-ggplot(ToothGrowth,aes(len,dose))+geom_point(size=3)
ScatterPlotImage
Output
ggsave(file="Scatter.svg", plot=ScatterPlotImage, width=10, height=10)
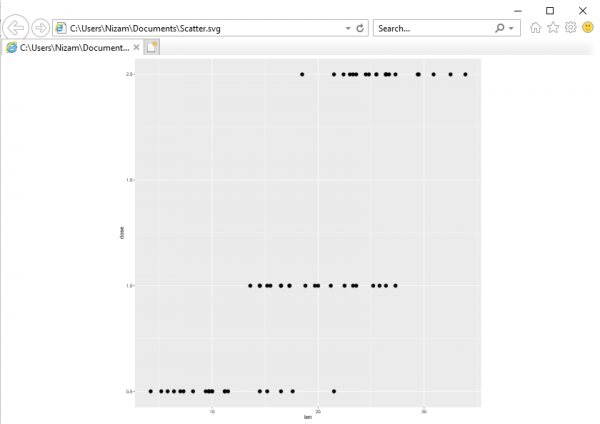
This plot will be saved as an SVG in the default folder for your R version as shown above.

Updated on: 2026-03-11T23:22:53+05:30
5K+ Views

Advertisements