
Article Categories
- All Categories
-
 Data Structure
-
 Networking
-
 RDBMS
RDBMS
-
 Operating System
-
 Java
Java
-
 MS Excel
-
 iOS
iOS
-
 HTML
HTML
-
 CSS
CSS
-
 Android
-
 Python
-
 C Programming
-
 C++
C++
-
 C#
C#
-
 MongoDB
-
 MySQL
MySQL
-
 Javascript
-
 PHP
PHP
-
 Economics & Finance
Selected Reading
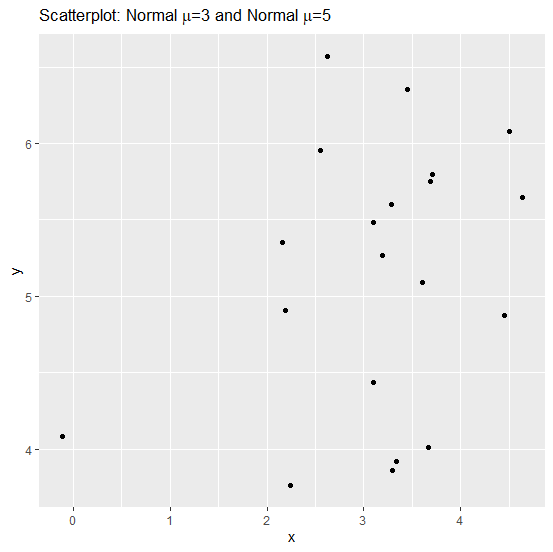
How to create a plot title with unicode characters using ggplot2 in R?
If we want to use unicode characters in the title for a plot created with the help of ggplot2 package then the ggtitle function will be used combined with functions called expression and paste. Using the expression and paste functions, we can write unicode characters for the title of the plot. Check out the below examples to understand how it works.
Example
Consider the below data frame −
> x<-rnorm(20,3,1.04)
> y<-rnorm(20,5,1.04)
> df<-data.frame(x,y)
> df
Output
      x        y
1 3.4501307 6.354644
2 2.1561511 5.349282
3 4.5018653 6.080046
4 2.5512959 5.957558
5 3.6818738 5.749713
6 3.3348023 3.915156
7 2.1848075 4.906206
8 4.6387566 5.648459
9 3.6686153 4.008336
10 3.0933511 4.435458
11 3.2876128 5.604236
12 3.7064604 5.798906
13 3.0934262 5.482318
14 -0.1128137 4.078793
15 3.2962783 3.856228
16 2.6180760 6.573215
17 3.1926398 5.268238
18 3.6050967 5.091978
19 4.4557263 4.874268
20 2.2436163 3.757898
Loading ggplot2 package and creating the plot with title having unicode character mu −
Example
> library(ggplot2)
> ggplot(df,aes(x,y))+geom_point()+ggtitle(expression(paste("Scatterplot: Normal ",mu,"=3 ","and Normal ",mu,"=5")))
Output

Updated on: 2026-03-11T22:50:54+05:30
900 Views

Advertisements