
 Data Structure
 Networking
 RDBMS
RDBMS Operating System
 Java
Java MS Excel
 iOS
iOS HTML
HTML CSS
CSS Android
 Python
 C Programming
 C++
C++ C#
C# MongoDB
 MySQL
MySQL Javascript
 PHP
PHP
- Selected Reading
- UPSC IAS Exams Notes
- Developer's Best Practices
- Questions and Answers
- Effective Resume Writing
- HR Interview Questions
- Computer Glossary
- Who is Who
How to plot a function in R?
Plotting a function in R is not a difficult task. We can do it simply with curve function but if the function is very complex then it inside curve function might be difficult. It totally depends on the understand of the person who wants to plot the function, if he or she is well versed with the function then it won’t take much time, otherwise it becomes tedious.
Example
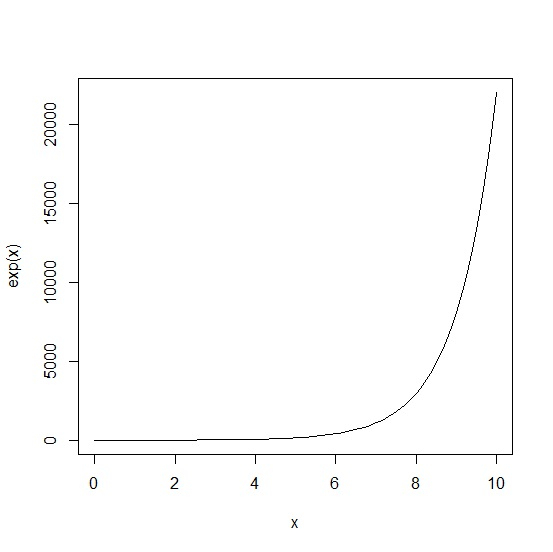
> curve(exp(x),from=0, to=10)
Output
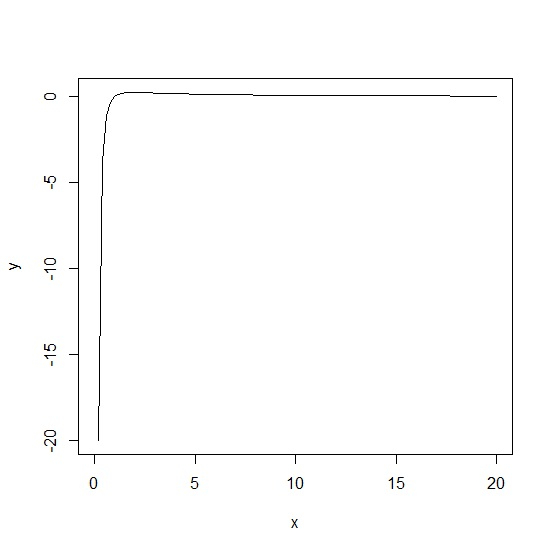
> curve((x-1)/(x^2),from=0, to=20,ylab="y")
Output
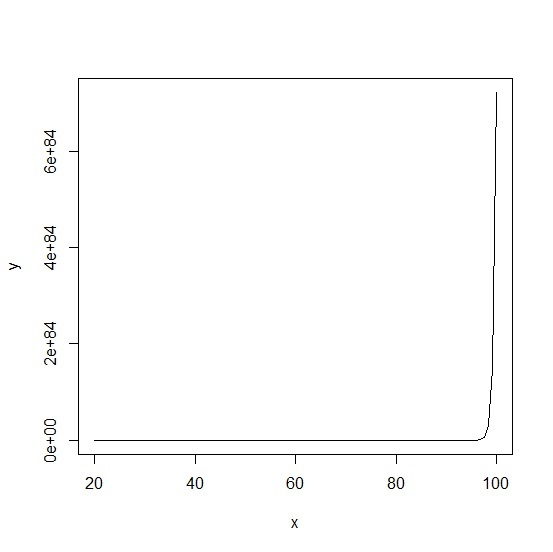
> curve(((exp(x))^2)/(x),from=20, to=100,ylab="y")
Output

Updated on: 2020-08-12T10:05:20+05:30
531 Views

Advertisements