
Article Categories
- All Categories
-
 Data Structure
-
 Networking
-
 RDBMS
RDBMS
-
 Operating System
-
 Java
Java
-
 MS Excel
-
 iOS
iOS
-
 HTML
HTML
-
 CSS
CSS
-
 Android
-
 Python
-
 C Programming
-
 C++
C++
-
 C#
C#
-
 MongoDB
-
 MySQL
MySQL
-
 Javascript
-
 PHP
PHP
-
 Economics & Finance
Selected Reading
How to create a plot in R with a different plot window size using plot function?
We can create plots in R with having different plot window sizes. This will be helpful when we want to express X-axis or Y-axis differently. Also, the change in the size of the plot window will help us to paste the plot in places that are short or large. For example, if we want to present the plot in a business meeting then we can increase its size and if we want to publish it in a paper then its size can be decreased.
Example
Consider the below vectors x and y −
> x<-1:20
> y<-20:1
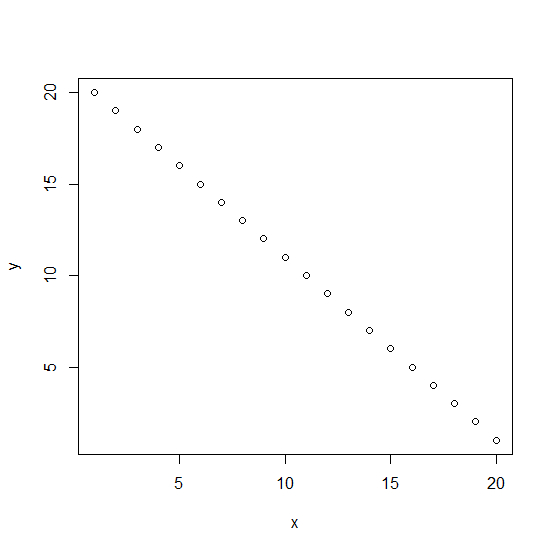
Plotting with default −
> plot(x,y)
Output
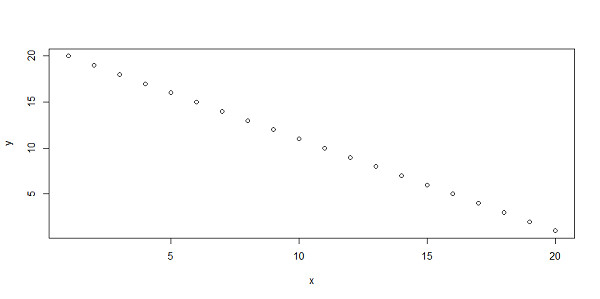
Plotting with 10-inch-wide and 5 inch in height −
> dev.new(width=10, height=5, unit="in")
> plot(x,y)
Output
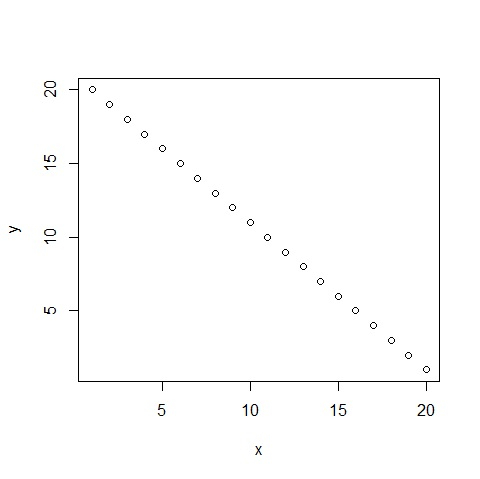
Plotting with 10-cm-wide and 5-cm in height −
> dev.new(width=5, height=5, unit="cm")
> plot(x,y)
Output
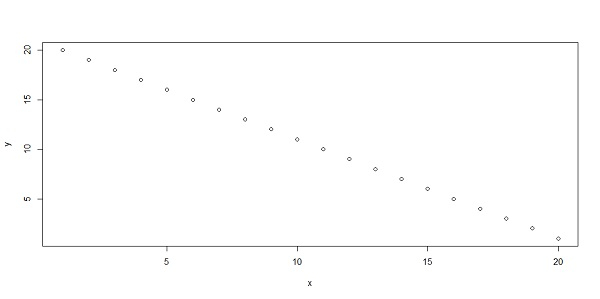
Plotting with 100x50 pixel −
> dev.new(width=100, height=50, unit="px")
> plot(x,y)
Output

Updated on: 2020-08-12T13:35:55+05:30
12K+ Views

Advertisements