
Article Categories
- All Categories
-
 Data Structure
-
 Networking
-
 RDBMS
RDBMS
-
 Operating System
-
 Java
Java
-
 MS Excel
-
 iOS
iOS
-
 HTML
HTML
-
 CSS
CSS
-
 Android
-
 Python
-
 C Programming
-
 C++
C++
-
 C#
C#
-
 MongoDB
-
 MySQL
MySQL
-
 Javascript
-
 PHP
PHP
-
 Economics & Finance
Selected Reading
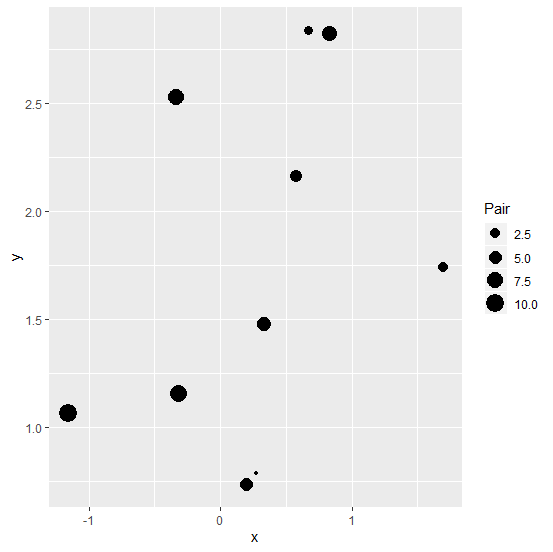
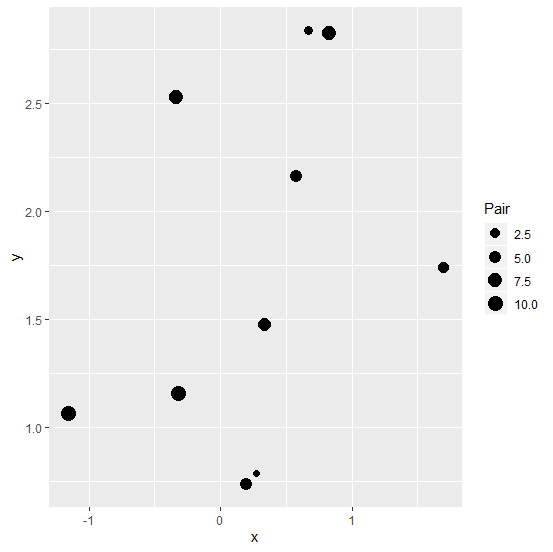
How to increase the size of points on a scatterplot if the points are drawn based on another sequence using ggplot2 in R?
When we draw a scatterplot using ggplot2 with points based on a sequence of values then the size of the points might be very small for the small values. As a result, it becomes a little difficult to view the points. Therefore, we might want to increase the size of those points. It can be done by using scale_size_continuous function in which we can set a range for the points size.
Example
Consider the below data frame −
x<-rnorm(10,1)
y<-rnorm(10,2)
Pair<-1:10
df<-data.frame(x,y,Pair)
df
Output
      x       y         Pair
1 0.2722750 0.7855144    1
2 0.6708724 2.8385502    2
3 1.6939261 1.7415868    3
4 0.5773440 2.1596557    4
5 0.1965571 0.7356820    5
6 0.3368027 1.4774414    6
7 0.8248820 2.8211750    7
8 -0.3364834 2.5258274   8
9 -0.3229903 1.1579749   9
10 -1.1594988 1.0636472  10
Loading ggplot2 package and creating a scatterplot with points size based on Pair column −
Example
library(ggplot2)
ggplot(df,aes(x,y,size=Pair))+geom_point()
Output
Creating the scatterplot with a range of point size −
Example
ggplot(df,aes(x,y,size=Pair))+geom_point()+scale_size_continuous(range = c(2,5))
Output

Updated on: 2026-03-11T22:50:51+05:30
686 Views

Advertisements