
Article Categories
- All Categories
-
 Data Structure
-
 Networking
-
 RDBMS
RDBMS
-
 Operating System
-
 Java
Java
-
 MS Excel
-
 iOS
iOS
-
 HTML
HTML
-
 CSS
CSS
-
 Android
-
 Python
-
 C Programming
-
 C++
C++
-
 C#
C#
-
 MongoDB
-
 MySQL
MySQL
-
 Javascript
-
 PHP
PHP
-
 Economics & Finance
Selected Reading
How to create a scatterplot with low intensity of points using ggplot2 in R?
To create a scatterplot with low intensity of points using ggplot2, we can follow the below steps −
- First of all, create a data frame.
- Then, create the scatterplot.
- Create the scatterplot with scale_color_hue function for low intensity of points.
Create the data frame
Let's create a data frame as shown below −
x<-rnorm(25)
y<-rnorm(25)
Category<-sample(LETTERS[1:3],25,replace=TRUE)
df<-data.frame(x,y,Category)
df
On executing, the above script generates the below output(this output will vary on your system due to randomization) −
        x             y    Category
1   1.12029660  1.798400854  B
2  -0.92627226  0.012693777  B
3   0.08246051 -1.023041721  B
4   0.74518421  0.011659665  A
5  -0.58230502  1.989721818  B
6  -0.33260317  1.634187623  A
7   0.99057313  2.301538677  B
8  -1.84009486 -0.359357332  A
9  -0.72119221 -0.713702991  A
10 -0.32797371  1.085256326  B
11 -0.66707938 -0.007620469  A
12 -0.03114908  1.682230334  B
13  0.28675230  2.149633140  A
14  0.92106137  0.726502687  B
15  2.48582864 -0.886252989  B
16  0.67901026 -0.077100236  B
17 -0.49207964  0.866949278  C
18 -0.06498771 -0.377925875  C
19 -0.67773914 -1.007353247  A
20  0.60461753 -2.014343915  B
21 -0.78234868 -0.050558502  C
22  0.66883287  0.840200263  A
23  0.91851546 -0.448334545  A
24  0.52271830  0.266627647 A
25 -1.04105075 -0.916067803  A
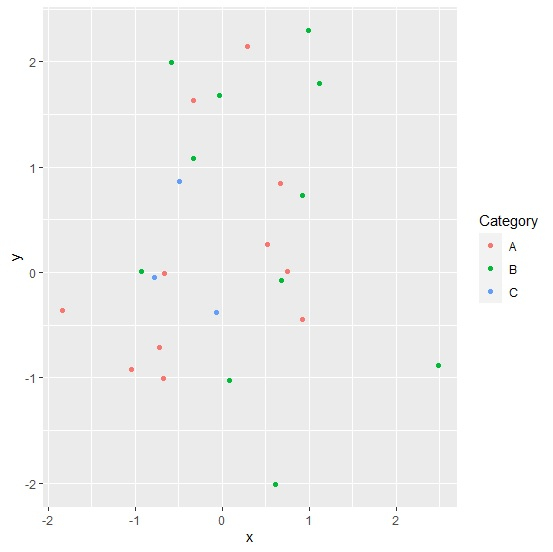
Create the scatterplot
Use geom_point function of ggplot2 package to create the scatterplot −
x<-rnorm(25)
y<-rnorm(25)
Category<-sample(LETTERS[1:3],25,replace=TRUE)
df<-data.frame(x,y,Category)
library(ggplot2)
ggplot(df,aes(x,y,color=Category))+geom_point()
Output
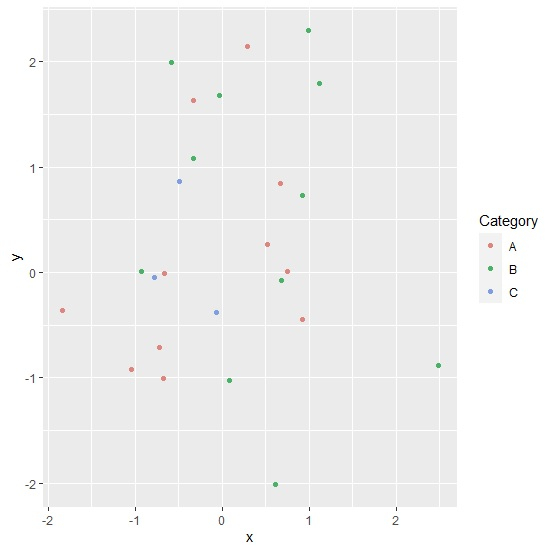
Create the scatterplot with low intensity of points
Use scale_color_hue function of ggplot2 package with c argument to create the scatterplot with low intensity of points(the default values for c is 100) −
x<-rnorm(25)
y<-rnorm(25)
Category<-sample(LETTERS[1:3],25,replace=TRUE)
df<-data.frame(x,y,Category)
library(ggplot2)
ggplot(df,aes(x,y,color=Category))+geom_point()+scale_color_hue(c=65)
Output

Updated on: 2026-03-11T22:50:58+05:30
438 Views

Advertisements