
Article Categories
- All Categories
-
 Data Structure
-
 Networking
-
 RDBMS
RDBMS
-
 Operating System
-
 Java
Java
-
 MS Excel
-
 iOS
iOS
-
 HTML
HTML
-
 CSS
CSS
-
 Android
-
 Python
-
 C Programming
-
 C++
C++
-
 C#
C#
-
 MongoDB
-
 MySQL
MySQL
-
 Javascript
-
 PHP
PHP
-
 Economics & Finance
Selected Reading
How to create a scatterplot in base R with points depending on categorical column?
To create a scatterplot in base R with points depending on categorical column, we can follow the below steps −
- First of all, create a data frame.
- Then, use plot function to create the scatterplot with col argument and using categorical column with factor function.
Create the data frame
Let's create a data frame as shown below −
x<-rnorm(20)
y<-rnorm(20)
Categories<-sample(c("Low","Medium","High"),20,replace=TRUE)
df<-data.frame(x,y,Categories)
df
On executing, the above script generates the below output(this output will vary on your system due to randomization) −
        x             y     Categories
1  -2.05786236   -0.6386997 Medium
2  -0.47838709    0.6307490 Low
3  2.26748023     0.1583581 High
4  0.18724881    -1.1412040 Medium
5  2.38446518    -0.3039254 Medium
6  0.02884067     2.2569030 Medium
7  -0.41569491    -0.6915881 Low
8  1.94247780     0.4336902 Low
9   0.12884274    -0.9464682 Low
10  2.01637882     1.0660766 Medium
11  0.49692206     0.6047239 High
12  0.65897845     0.1822955 High
13  -0.15872282    1.1882572 High
14  0.09055200    -0.4810778 Low
15  0.58098900    -1.1208266 High
16 -1.29387993    1.3681760 Low
17 -1.03111117   -0.7245990 High
18 -0.92317667 -0.1784569 High
19 -1.61755231 -1.4693293 High
20 -0.37555487 -1.8116867 Medium
Create the scatterplot
Using plot function to create the scatterplot with Categories column read as factor in col argument −
x<-rnorm(20)
y<-rnorm(20)
Categories<-sample(c("Low","Medium","High"),20,replace=TRUE)
df<-data.frame(x,y,Categories)
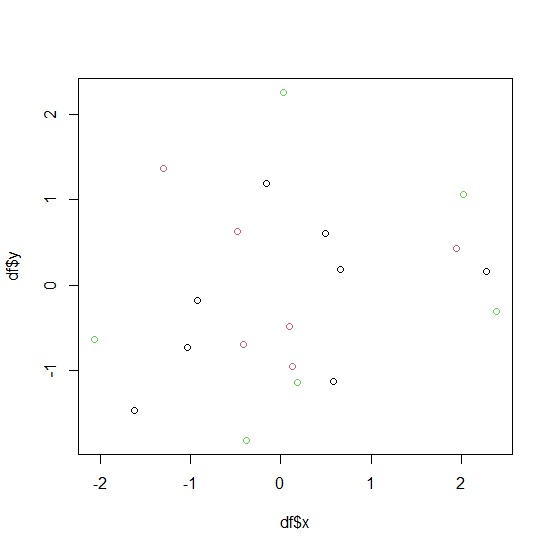
plot(df$x,df$y,col=factor(df$Categories))
Output

Updated on: 2026-03-11T22:50:58+05:30
278 Views

Advertisements