
Article Categories
- All Categories
-
 Data Structure
-
 Networking
-
 RDBMS
RDBMS
-
 Operating System
-
 Java
Java
-
 MS Excel
-
 iOS
iOS
-
 HTML
HTML
-
 CSS
CSS
-
 Android
-
 Python
-
 C Programming
-
 C++
C++
-
 C#
C#
-
 MongoDB
-
 MySQL
MySQL
-
 Javascript
-
 PHP
PHP
-
 Economics & Finance
Selected Reading
How to create a scatterplot using ggplot2 with different shape and color of points based on a variable in R?
In general, the default shape of points in a scatterplot is circular but it can be changed to other shapes using integers or sequence or the variable. We just need to use the argument shape inside geom_point function and pass the variable name. For example, if we want to create the scatterplot with varying shapes of a variable x then we can use geom_point(shape=x). And if we want to change the size then integer values can be used.
Example
Consider the below data frame −
set.seed(151)
x<-rnorm(20,5,1)
y<-rnorm(20,5,2)
df<-data.frame(x,y)
df
Output
      x       y
1 4.948461 2.255857
2 5.765737 1.726474
3 4.853260 4.280697
4 4.886814 7.402230
5 4.604489 3.708252
6 5.782276 3.978782
7 3.602522 3.801754
8 3.981162 6.091206
9 5.229476 4.017412
10 5.672173 5.383071
11 4.515448 3.882945
12 5.560609 6.845399
13 5.066156 7.307996
14 3.650124 2.255179
15 4.757084 7.580363
16 3.763259 7.309804
17 3.525322 7.891359
18 7.437159 5.522026
19 5.673526 8.858292
20 5.310040 3.800228
Loading ggplot2 package and creating point chart between x and y −
Example
library(ggplot2)
ggplot(df,aes(x,y))+geom_point()
Output
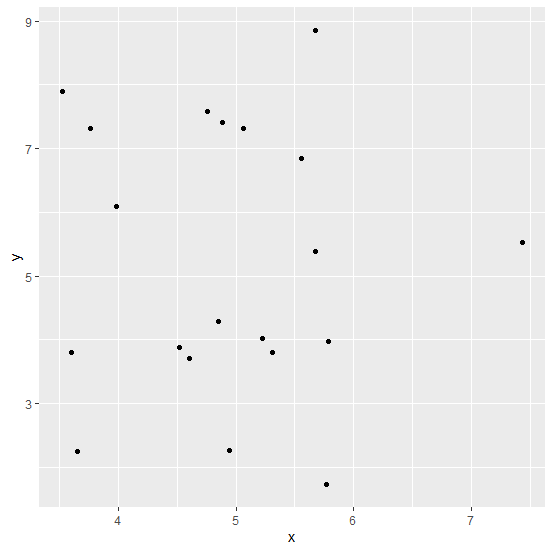
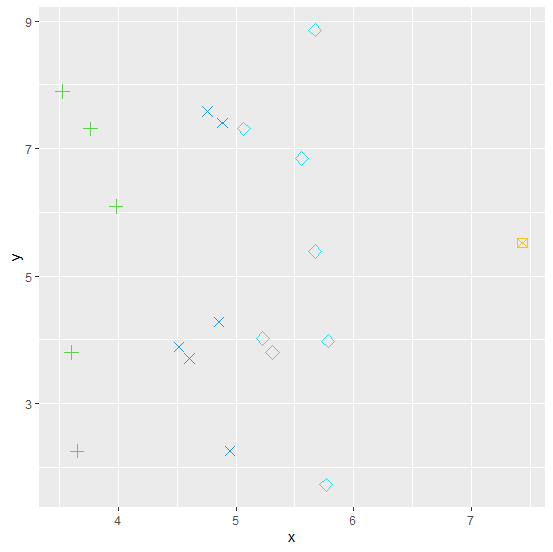
Creating the scatterplot by different shape of the points and the size = 3 −
Example
ggplot(df,aes(x,y))+geom_point(shape=x,color=x,size=3)
Output

Updated on: 2026-03-11T22:50:52+05:30
655 Views

Advertisements