
Article Categories
- All Categories
-
 Data Structure
-
 Networking
-
 RDBMS
RDBMS
-
 Operating System
-
 Java
Java
-
 MS Excel
-
 iOS
iOS
-
 HTML
HTML
-
 CSS
CSS
-
 Android
-
 Python
-
 C Programming
-
 C++
C++
-
 C#
C#
-
 MongoDB
-
 MySQL
MySQL
-
 Javascript
-
 PHP
PHP
-
 Economics & Finance
Selected Reading
How to exclude extra margin between points and the axes for a plot created by using ggplot2 in R?
In a plot created by using ggplot package there exists an extra area around all the sides of the plot which uses extra space, thus we might want to get rid of that space by removing that extra margin area. It can be done by setting the scale for both the axes to zero with the help of scale_x_continuous and scale_y_continuous function.
Consider the below data frame −
Example
set.seed(151)
x<-rnorm(20,5,1)
y<-rnorm(20,5,2)
df<-data.frame(x,y)
df
Output
      x         y
1  4.948461 2.255857
2  5.765737 1.726474
3  4.853260 4.280697
4  4.886814 7.402230
5  4.604489 3.708252
6  5.782276 3.978782
7  3.602522 3.801754
8  3.981162 6.091206
9  5.229476 4.017412
10 5.672173 5.383071
11 4.515448 3.882945
12 5.560609 6.845399
13 5.066156 7.307996
14 3.650124 2.255179
15 4.757084 7.580363
16 3.763259 7.309804
17 3.525322 7.891359
18 7.437159 5.522026
19 5.673526 8.858292
20 5.310040 3.800228
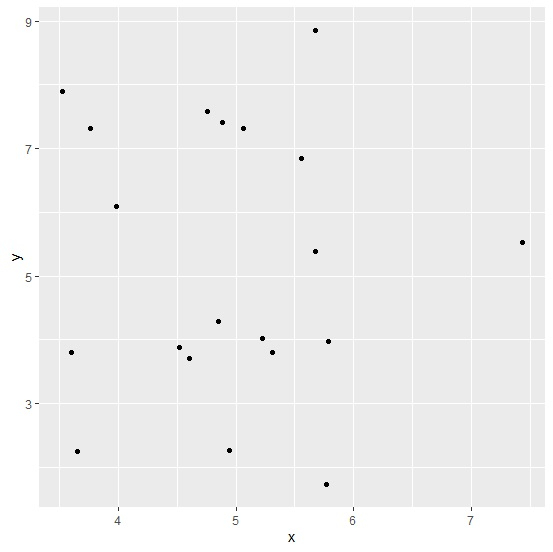
Loading ggplot2 package and creating scatterplot between x and y −
Example
library(ggplot2)
ggplot(df,aes(x,y))+geom_point()
Output
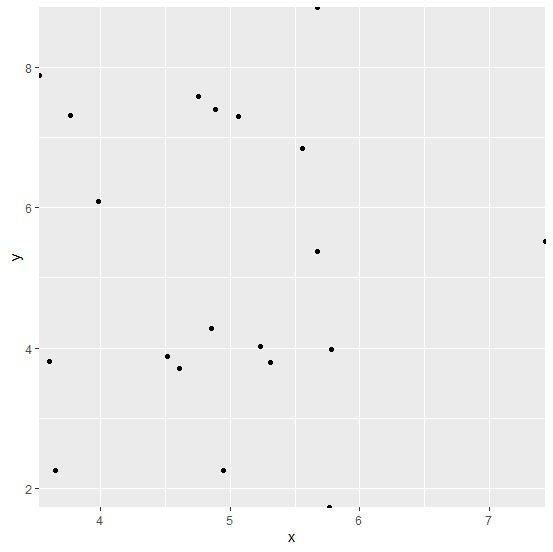
Creating scatterplot between x and y by excluding the extra margin area −
Example
ggplot(df,aes(x,y))+geom_point()+scale_x_continuous(expand=c(0,0))+scale_y_continuous(expand=c(0,0))
Output

Updated on: 2026-03-11T22:50:53+05:30
1K+ Views

Advertisements