
Article Categories
- All Categories
-
 Data Structure
-
 Networking
-
 RDBMS
RDBMS
-
 Operating System
-
 Java
Java
-
 MS Excel
-
 iOS
iOS
-
 HTML
HTML
-
 CSS
CSS
-
 Android
-
 Python
-
 C Programming
-
 C++
C++
-
 C#
C#
-
 MongoDB
-
 MySQL
MySQL
-
 Javascript
-
 PHP
PHP
-
 Economics & Finance
How to Export Charts to Graphics in Excel
Exporting charts to graphics in Excel allows you to save your visual representations as standalone image files that can be easily shared, inserted into documents, or used in presentations. Whether you need to include charts in reports, share them with colleagues, or utilize them in other applications, exporting charts as graphics provides a convenient way to capture and distribute the visual data.
With various formats to choose from, such as JPEG, PNG, or GIF, you can select the most suitable format for your specific needs. By following simple methods within Excel, you can swiftly export your charts as graphics and make them more accessible and versatile in various contexts.
Steps to Export Charts to Graphics in Excel
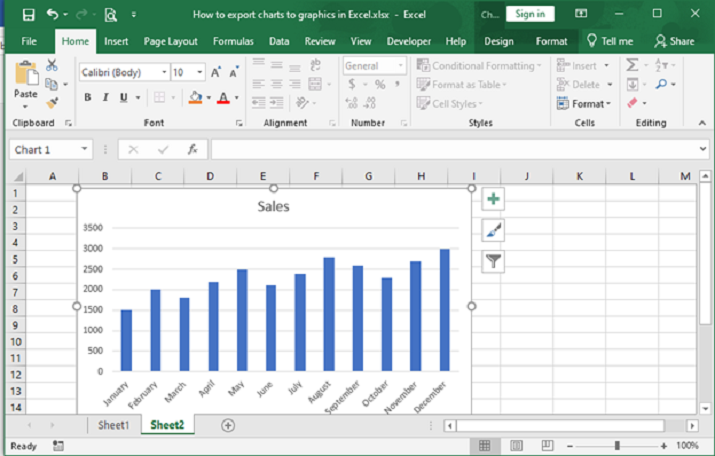
Step 1: Open your Excel file First, open the Excel file that you want to work with. If you don't have an Excel file yet, create one by clicking on the "New Workbook" button on the Excel start page.
Step 2:Create a chart as follows.
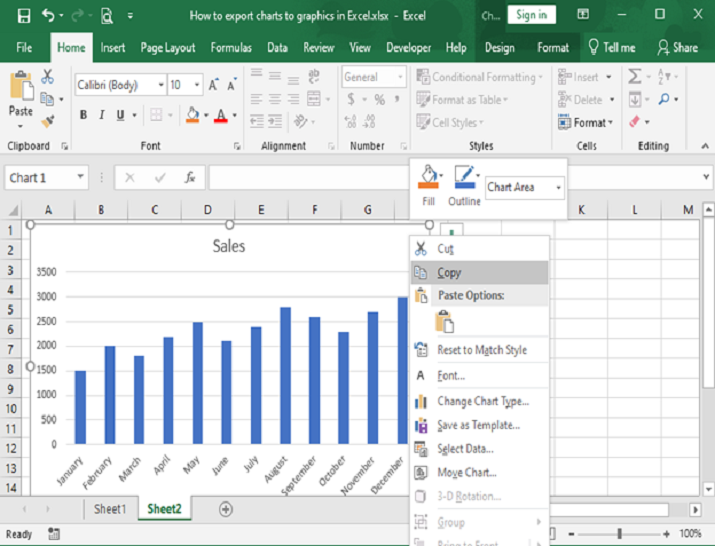
Step 3: Select the chart in your Excel worksheet by clicking on it. Once the chart is selected, right?click on it. A context menu will appear. In the context menu, choose the Copy option.
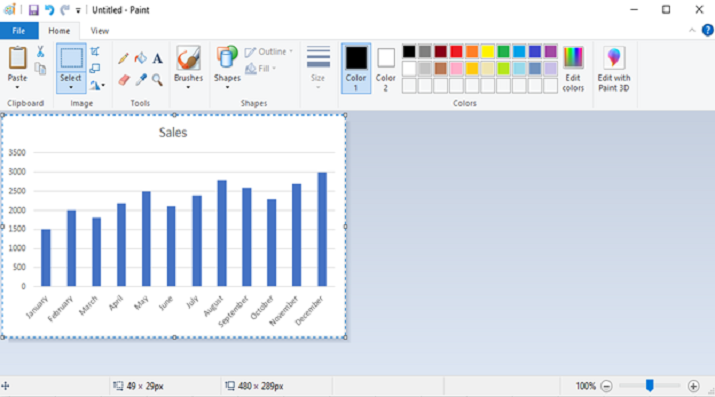
Step 4:Step 4: If you chose the "Copy" option, the chart will be copied to your clipboard. Open an image editing software or a blank document in a program like MS Paint, Photoshop, Word, or PowerPoint. In our case, MS Paint is chosen.
In the image editing software or blank document, paste the copied chart. You can either press "Ctrl+V" on your keyboard or right?click and select "Paste" from the context menu. See screenshot:
Step 5:Once the chart is pasted, you can save it as an image file in the desired format. Go to the "File" menu or right?click on the image and choose the "Save As" or "Save Image As" option. Specify the location, name, and format (JPEG, PNG, GIF, etc.) for the exported chart.
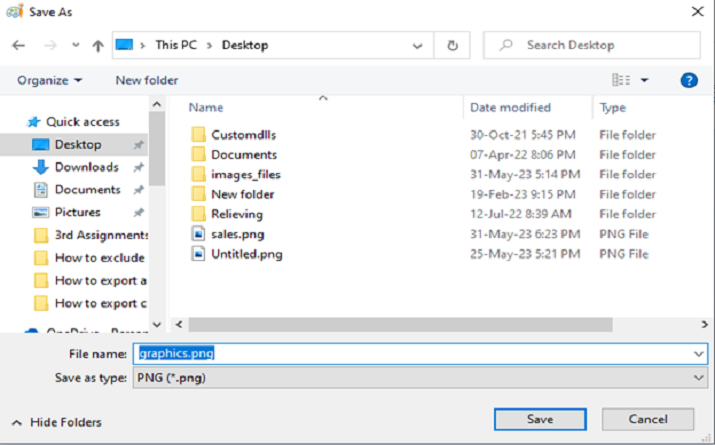
Step 6: Click "Save" to save the chart as a graphic file. The file is saved on desktop as ghaphics.png .

Conclusion
In conclusion, exporting charts to graphics in Excel is a straightforward process that can be accomplished using the right?click and copy?paste method or by selecting the "Save as Picture" option. These alternate simple methods eliminate the need for navigating through multiple menu options and provide a quick way to save your charts as image files.
By following these steps, you can efficiently export your Excel charts as graphics, making them easily shareable, insertable, and usable in other applications. Whether you're creating reports, presentations, or documents, exporting charts to graphics offers a convenient way to incorporate visual data in a variety of contexts.

383 Views
