
Article Categories
- All Categories
-
 Data Structure
-
 Networking
-
 RDBMS
RDBMS
-
 Operating System
-
 Java
Java
-
 MS Excel
-
 iOS
iOS
-
 HTML
HTML
-
 CSS
CSS
-
 Android
-
 Python
-
 C Programming
-
 C++
C++
-
 C#
C#
-
 MongoDB
-
 MySQL
MySQL
-
 Javascript
-
 PHP
PHP
-
 Economics & Finance
How to prevent resizing charts when resizing rows and columns in Excel?
Introduction
Users of Excel may create charts to visually represent data. When rows or columns are rearranged in Excel, the connected chart may be resized automatically, which might throw off the chart's appearance and proportions. Maintaining the original dimensions of your charts is essential if you care about how they look when rows and columns are rearranged. In this article, I'll discuss what causes Excel charts to resize without your intervention and how to easily fix the problem. When you take these measures, you can be certain that updating the rows and columns of your charts won't compromise their visual appeal or their capacity to effectively represent the data.
Why Does it Happen?
One of Excel's most useful features is its ability to automatically resize charts to account for changes to the data range they are based on. This function guarantees that the chart's proportions are preserved and that the new information is appropriately reflected. The chart automatically adjusts its size when rows or columns are adjusted.
It is common practice to attach Excel charts to individual cells. Anchor cells undergo dimensional changes if the rows or columns containing them are resized. As a result, the size of the connected chart changes such that it always fits inside the bounds of the anchor cells. This anchoring system keeps the chart focused on the desired data.
The purpose of charts that automatically resize themselves is to give flexibility and guarantee that the visual representation of data does not deviate from its original form. However, it can sometimes lead to undesired changes in the chart's appearance and proportions, particularly if you want to maintain a specific size or layout for the chart.
To prevent these automatic adjustments and maintain the desired size and proportions of a chart, specific preventive measures need to be implemented, such as locking the aspect ratio or positioning the chart on a separate sheet. These techniques help preserve the integrity and consistent display of charts even when rows and columns are resized.
The following procedures will prevent a chart in Excel from scaling if the row or column widths are changed.
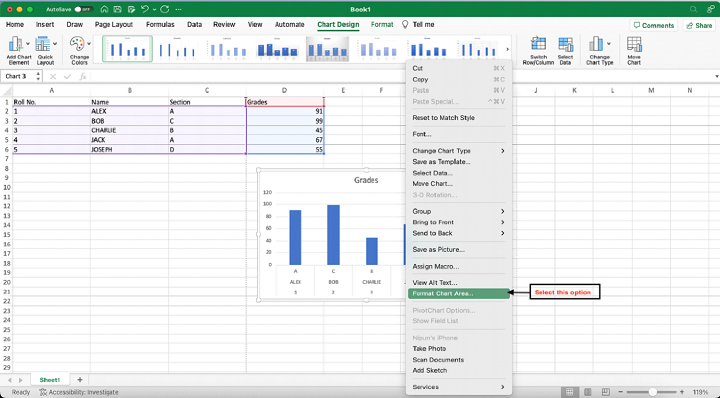
Choose the graph you don't want to resize.

Select "Format Chart Area" from the menu that appears when you right-click the chart. The Chart Area Formatting window will pop up.
Select the "Size & Properties" icon (it looks like a paintbrush) in the Format Chart Area submenu.

Look for the "Properties" subheading under "Size & Properties."
Deselect "Size with window" or "Move and size with cells." The precise language may be different depending on the version of Excel you're using.
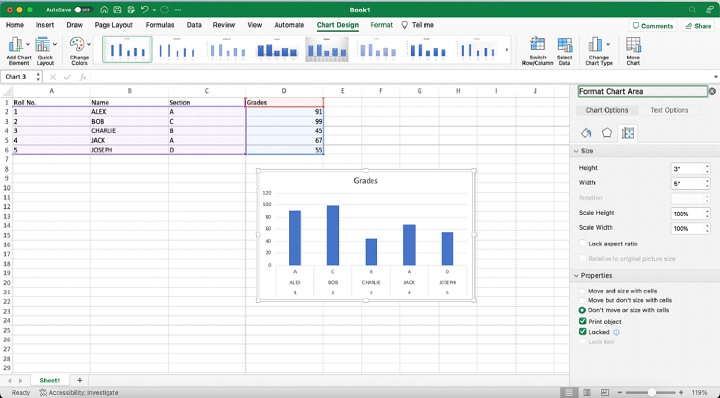
To hide the Format Chart Area window, just click anywhere outside of it.
When you're done, your chosen chart won't resize automatically if you change the width of the columns and rows in Excel. It won't shrink or move around the page.
Additional Tips
Always save a backup copy of your Excel file before making any changes to ensure that you can revert to the original version if needed.
If you need to resize the chart along with the rows or columns, you can uncheck the "Don't move or size with cells" option in the chart's properties. However, this will allow the chart to resize proportionally with the rows or columns.
Adjusting the chart's size manually after resizing rows or columns can lead to distortions. To avoid this, use the techniques described above to keep the chart fixed in size.
Conclusion
Preventing the resizing of charts when adjusting rows and columns in Excel is crucial for maintaining their visual impact and consistency. Excel's default behavior automatically resizes charts to adapt to changes in the data range, which may not always align with the desired presentation. This article has explored the reasons behind chart resizing and provided practical methods to prevent this from happening. By locking the aspect ratio of the chart or positioning it on a separate sheet, you can ensure that your charts remain unaffected by adjustments to rows and columns, preserving their intended appearance and data representation. By implementing these preventive measures, you can enhance the visual consistency and integrity of your charts within Excel.

2K+ Views
