
Article Categories
- All Categories
-
 Data Structure
-
 Networking
-
 RDBMS
RDBMS
-
 Operating System
-
 Java
Java
-
 MS Excel
-
 iOS
iOS
-
 HTML
HTML
-
 CSS
CSS
-
 Android
-
 Python
-
 C Programming
-
 C++
C++
-
 C#
C#
-
 MongoDB
-
 MySQL
MySQL
-
 Javascript
-
 PHP
PHP
-
 Economics & Finance
How To Delete All Charts In Excel Workbooks ?
In Excel, charts are a useful tool for visualising data and improving its understanding. To clean up your data or to start over with new visualisations, you may occasionally need to remove charts from your workbook. You will be guided step?by?step through the manual and automatic processes for removing all charts from Excel files in this tutorial. This tutorial will provide you the skills and expertise to effectively delete any charts from your workbook, regardless of how many you have dispersed throughout it. This will be done without affecting any other data or formatting. We will look at many strategies, letting you select the one that best fits your requirements and level of expertise.
By the time you finish this video, you will be confidently able to remove any chart from an Excel file, saving you time and energy when managing your data. So let's get going and explore the realm of Excel chart removal!
Delete All Charts
Here, we will first create a VBA module and then run it to complete the task. So let us see a simple process to know how you can delete all charts in Excel workbooks.
Step 1
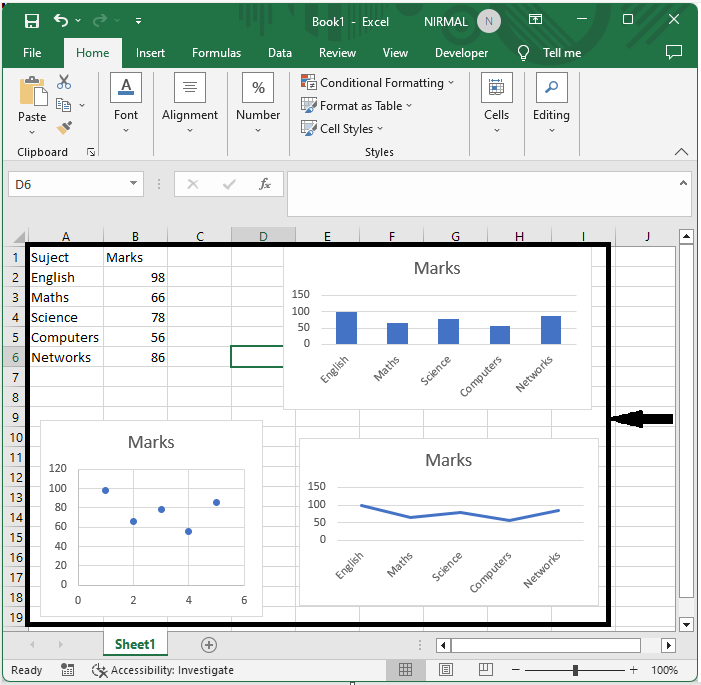
Consider an Excel sheet that contains charts similar to the below image.
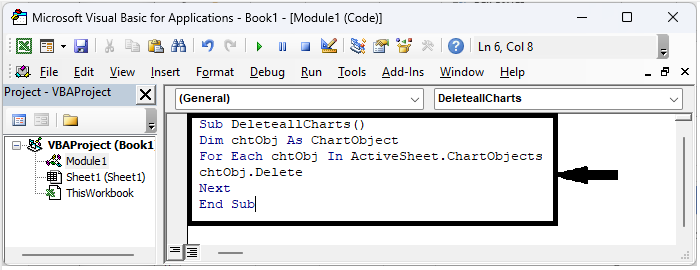
First, right?click on the sheet name and select "View Code" to open the VBA application. Then click on Insert, select Module, and copy the below code into the textbox.
Code
Sub DeleteallCharts()
Dim chtObj As ChartObject
For Each chtObj In ActiveSheet.ChartObjects
   chtObj.Delete
Next
End Sub
Step 2
Then save the sheet as macro?enabled code and click F5, and all the charts in the active sheet will be deleted.
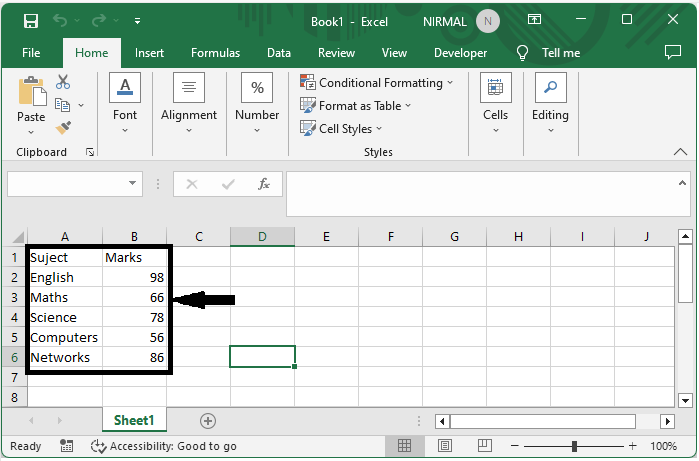
Note
This code will delete all the charts in the active worksheet.
Conclusion
In this tutorial, we have used a simple example to demonstrate how you can delete all charts in Excel workbooks to highlight a particular set of data.

906 Views
