
Article Categories
- All Categories
-
 Data Structure
-
 Networking
-
 RDBMS
RDBMS
-
 Operating System
-
 Java
Java
-
 MS Excel
-
 iOS
iOS
-
 HTML
HTML
-
 CSS
CSS
-
 Android
-
 Python
-
 C Programming
-
 C++
C++
-
 C#
C#
-
 MongoDB
-
 MySQL
MySQL
-
 Javascript
-
 PHP
PHP
-
 Economics & Finance
Selected Reading
How to add a vertical line with some value on a scatterplot created by ggplot2 in R?
When we draw a scatterplot, there might be some crucial points that we would want to display, hence we create a vertical or horizontal based on our objective. These vertical or horizontal lines can be drawn by using geom_vline or geom_hline function of ggplot2 but to add some value with them we can use geom_text function.
Example
Consider the below data frame −
> x<-rnorm(10)
> y<-rnorm(10,0.5)
> df<-data.frame(x,y)
> df
Output
      x          y
1 1.2474363 -0.15892165
2 1.7511870 -1.18938250
3 -1.3001612 -0.32313571
4 -1.4220049 1.52915756
5 0.4355646 0.18282983
6 0.3128323 0.16467130
7 1.5099580 1.15199751
8 -0.4907705 -1.98635182
9 -1.4249190 -0.73298079
10 -0.2409907 0.06120644
Example
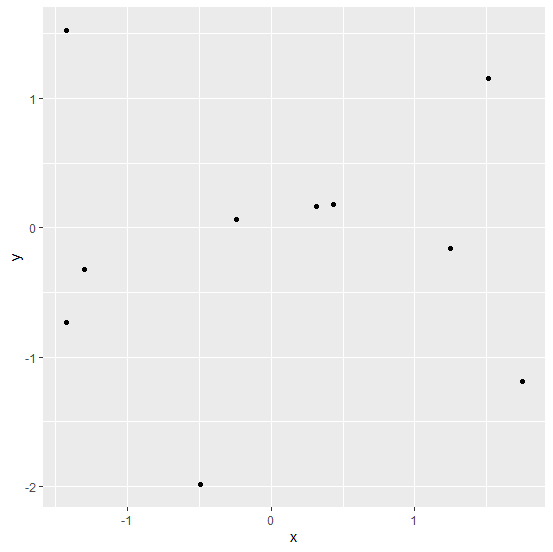
Loading ggplot2 package and creating a scatterplot between x and y −
> library(ggplot2)
> ggplot(df,aes(x,y))+geom_point()
Output
Example
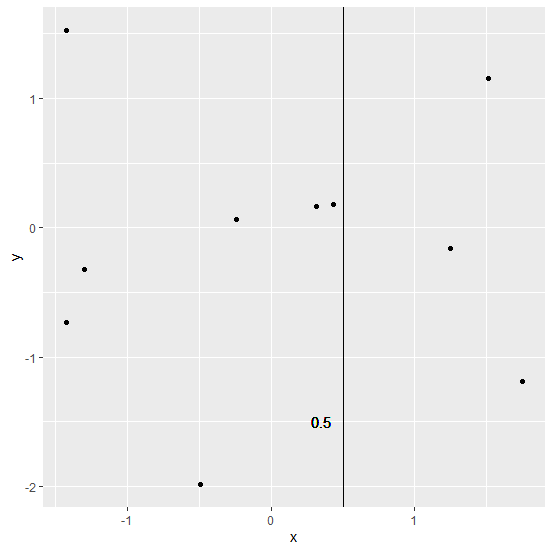
Creating a scatterplot between x and y with a vertical line showing a value −
> ggplot(df,aes(x,y))+geom_point()+geom_vline(aes(xintercept=0.5))+
+ geom_text(aes(0,-1.5,label=0.5,hjust=-2))
Output

Updated on: 2026-03-11T22:50:51+05:30
669 Views

Advertisements