
Article Categories
- All Categories
-
 Data Structure
-
 Networking
-
 RDBMS
RDBMS
-
 Operating System
-
 Java
Java
-
 MS Excel
-
 iOS
iOS
-
 HTML
HTML
-
 CSS
CSS
-
 Android
-
 Python
-
 C Programming
-
 C++
C++
-
 C#
C#
-
 MongoDB
-
 MySQL
MySQL
-
 Javascript
-
 PHP
PHP
-
 Economics & Finance
Selected Reading
How to create multiple bar plots for varying categories with same width bars using ggplot2 in R?
To create multiple bar plots for varying categories with same width bars using ggplot2, we would need to play with width argument inside geom_bar function to match the width of the bars in each bar plot. The best way to do this would be setting the larger ones to 0.25 and the shorter ones to 0.50.
Example
Consider the below data frame −
x1<-c("A","B")
y1<-c(21,23)
df1<-data.frame(x1,y1)
df1
Output
   x1  y1
1  A   21
2  B   23
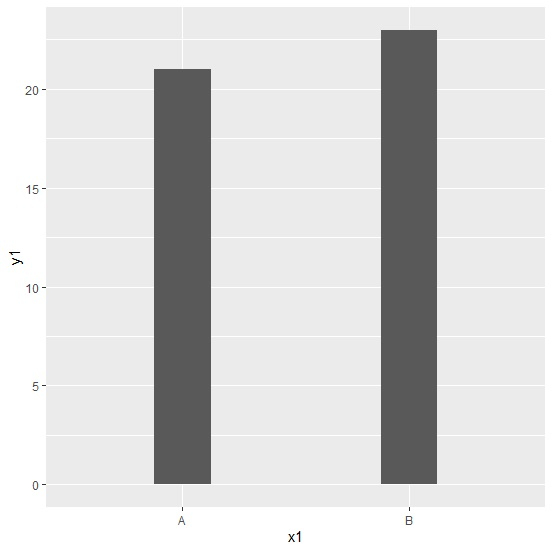
Loading ggplot2 package and creating bar plot for categories in x1 −
Example
library(ggplot2)
plot1<-ggplot(df1,aes(x1,y1))+geom_bar(stat="identity",width=0.25)
plot1
Output
Consider another data frame with more categories −
x2<-c("A","B","C","D")
y2<-c(21,24,25,23)
df2<-data.frame(x2,y2)
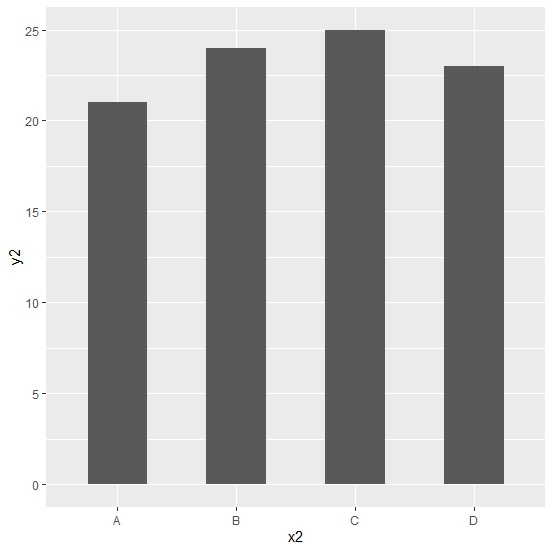
Creating the bar plot for categories in x2 that matches the width of the bars in plot1 −
Example
plot2<-ggplot(df2,aes(x2,y2))+geom_bar(stat="identity",width=0.5)
plot2
Output

Updated on: 2026-03-11T22:50:56+05:30
1K+ Views

Advertisements