
 Data Structure
 Networking
 RDBMS
RDBMS Operating System
 Java
Java MS Excel
 iOS
iOS HTML
HTML CSS
CSS Android
 Python
 C Programming
 C++
C++ C#
C# MongoDB
 MySQL
MySQL Javascript
 PHP
PHP
- Selected Reading
- UPSC IAS Exams Notes
- Developer's Best Practices
- Questions and Answers
- Effective Resume Writing
- HR Interview Questions
- Computer Glossary
- Who is Who
How to create scatterplot using ggplot2 without grey background in R?
To create scatterplot using ggplot2 without grey background in R, we can follow the below steps −
- First of all, create a data frame.
- Then, create the scatterplot using geom_point function of ggplot2 package.
- After that, add theme_minimal() function to the ggplot function.
Create the data frame
Let's create a data frame as shown below −
x<-rnorm(25)
y<-rnorm(25)
df<-data.frame(x,y)
df
On executing, the above script generates the below output(this output will vary on your system due to randomization) −
        x         y
1  -0.12641811  1.95757659
2  -1.38633565  0.77338055
3  -1.22762385 -0.44237134
4  -0.64563725  0.89688293
5   0.26524186 -0.70475151
6   0.17533808 -0.94449945
7  -0.49610310  0.39499452
8   0.63024372 -2.10619250
9  -0.26097072  0.72478045
10 -0.25907688  0.06150708
11  0.43858635  0.98054086
12 -0.47139236  1.27132622
13 -1.30498718 -0.20353174
14  0.15307884 -2.02789784
15  0.30174693 -1.15737060
16 -0.79224642 -1.20908515
17 -0.69133131 -1.07662121
18  0.84688970  0.47372022
19 -0.71300947 -0.42851191
20  0.04015489  0.41890481
21 -0.19846102  0.86615792
22 -0.37124762  0.16788345
23 -0.70334925  1.74406602
24  0.66638451  0.55980663
25  0.78728771  0.49338160
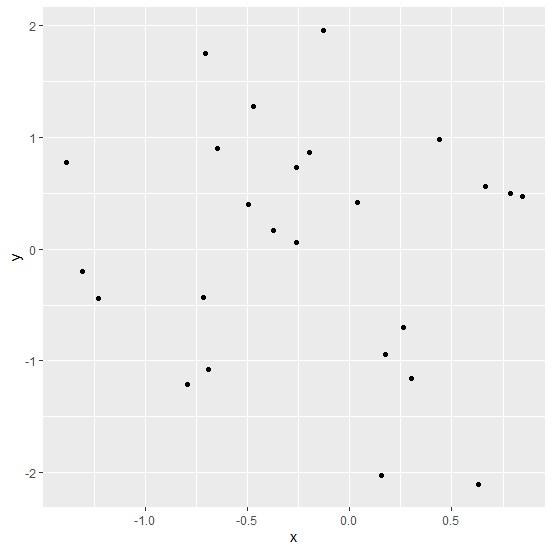
Create the scatterplot
Loading ggplot2 package and creating scatterplot between x and y −
x<-rnorm(25)
y<-rnorm(25)
df<-data.frame(x,y)
library(ggplot2)
ggplot(df,aes(x,y))+geom_point()
Output
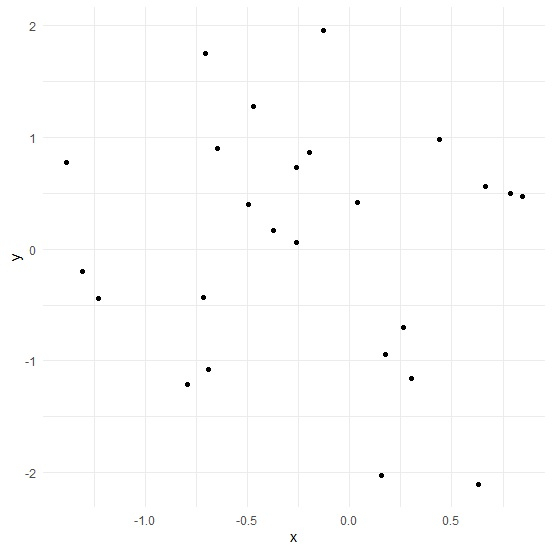
Create the scatterplot without grey background
Use theme_minimal() to create the scatterplot without grey background −
x<-rnorm(25)
y<-rnorm(25)
df<-data.frame(x,y)
library(ggplot2)
ggplot(df,aes(x,y))+geom_point()+theme_minimal()
Output

Updated on: 2021-08-14T08:55:48+05:30
287 Views

Advertisements