
Article Categories
- All Categories
-
 Data Structure
-
 Networking
-
 RDBMS
RDBMS
-
 Operating System
-
 Java
Java
-
 MS Excel
-
 iOS
iOS
-
 HTML
HTML
-
 CSS
CSS
-
 Android
-
 Python
-
 C Programming
-
 C++
C++
-
 C#
C#
-
 MongoDB
-
 MySQL
MySQL
-
 Javascript
-
 PHP
PHP
-
 Economics & Finance
Selected Reading
How to reduce the size of the area covered by legend in R for a plot created by using plot function?
By default, the area covered by legends for a plot created by using plot function is of full size that is 1 (the area size has a range of 0 to 1, where 1 refers to the full size and 0 refers to none). To reduce the size, we can use cex argument with the legend function as shown in the below example.
Example
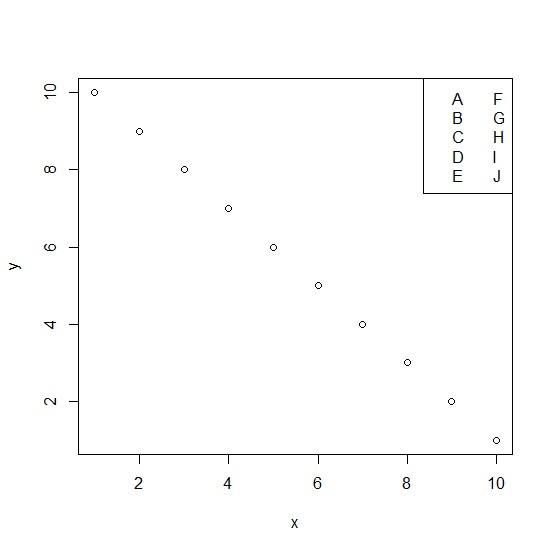
Consider the below vectors and the plot created between these two vectors −
x<-1:10
y<-10:1 plot((x,y) legend("topright",legend=LETTERS[1:10],ncol=2)
Output
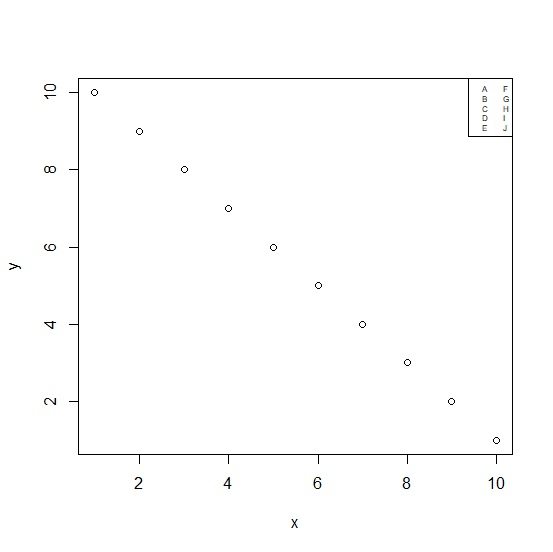
Now to create the plot with reduced size of the legend values and the legend area, we need to use the following codes −
x<-1:10
y<-10:1
plot(x,y) legend("topright",legend=LETTERS[1:10],ncol=2,cex=0.50)
Output

Updated on: 2020-10-08T14:39:15+05:30
2K+ Views

Advertisements