
Article Categories
- All Categories
-
 Data Structure
-
 Networking
-
 RDBMS
RDBMS
-
 Operating System
-
 Java
Java
-
 MS Excel
-
 iOS
iOS
-
 HTML
HTML
-
 CSS
CSS
-
 Android
-
 Python
-
 C Programming
-
 C++
C++
-
 C#
C#
-
 MongoDB
-
 MySQL
MySQL
-
 Javascript
-
 PHP
PHP
-
 Economics & Finance
Selected Reading
How to create plot in R with different shape of points?
In base R, the plot with different shape of points can be created by using pch argument inside the plot function. The list of pch values with shape is as written below −
pch = 0 display square
pch = 1 display circle
pch = 2 display triangle point up
pch = 3 display plus
pch = 4 display cross
pch = 5 display diamond
pch = 6 display triangle point down
pch = 7 display square cross
pch = 8 display star
pch = 9 display diamond plus
pch = 10 display circle plus
pch = 11 display triangles up and down
pch = 12 display square plus
pch = 13 display circle cross
pch = 14 display square and triangle down
pch = 15 display filled square
pch = 16 display filled circle
pch = 17 display filled triangle point-up
pch = 18 display filled diamond
pch = 19 display solid circle
pch = 20 display bullet (smaller circle)
pch = 21 display filled circle blue
pch = 22 display filled square blue
pch = 23 display filled diamond blue
pch = 24 display filled triangle point-up blue
pch = 25 display filled triangle point down blue
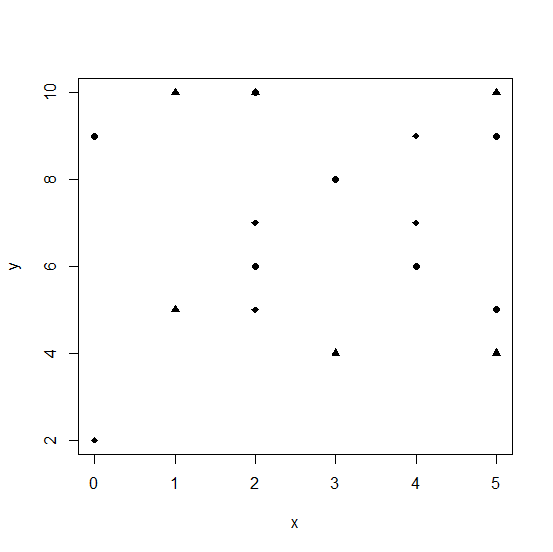
Example
Consider the below vectors and create a point chart with three different shapes −
x<-sample(0:5,20,replace=TRUE)
y<-sample(1:10,20,replace=TRUE)
plot(x,y,pch=c(16,17,18))
Output
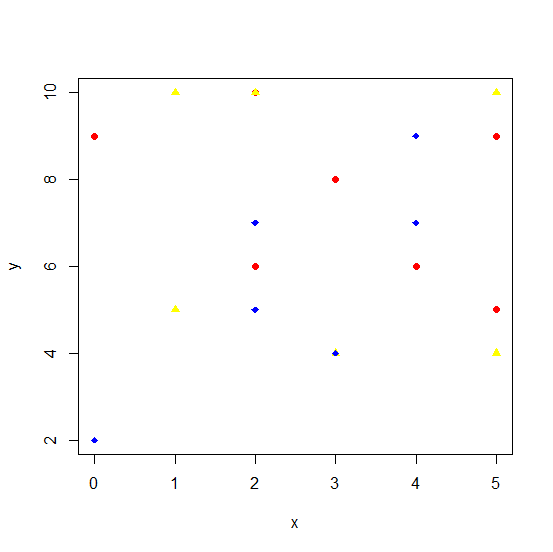
Creating the same plot with different colors of the shapes −
Example
plot(x,y,pch=c(16,17,18),col=c("red","yellow","blue"))
Output

Updated on: 2026-03-11T22:50:52+05:30
1K+ Views

Advertisements