
Article Categories
- All Categories
-
 Data Structure
-
 Networking
-
 RDBMS
RDBMS
-
 Operating System
-
 Java
Java
-
 MS Excel
-
 iOS
iOS
-
 HTML
HTML
-
 CSS
CSS
-
 Android
-
 Python
-
 C Programming
-
 C++
C++
-
 C#
C#
-
 MongoDB
-
 MySQL
MySQL
-
 Javascript
-
 PHP
PHP
-
 Economics & Finance
Selected Reading
How to create boxplot of vectors having different lengths in R?
If we have multiple vectors of different lengths then the boxplot for such vectors can be created by creating a single data frame using those vectors with a categorical column showing the name of the vectors and a numerical column having the corresponding values. Then boxplot function will be used as shown in the below example.
Example
Consider the below vector x and y and create the data frame using them −
> x<-rpois(20,2)
> y<-rpois(15,2)
> df<-data.frame(X=c(x,y),Grp=rep(c("x","y"),times=c(20,15)))
> df
Output
   X Grp
1  4   x
2  2   x
3  1   x
4  2   x
5  0   x
6  2   x
7  3   x
8  1   x
9  0   x
10 1   x
11 3   x
12 4   x
13 2   x
14 3   x
15 4   x
16 1   x
17 1   x
18 1   x
19 1   x
20 1   x
21 1   y
22 0   y
23 1   y
24 4   y
25 1   y
26 1   y
27 2   y
28 3   y
29 1   y
30 5   y
31 2   y
32 0   y
33 1   y
34 4   y
35 1   y
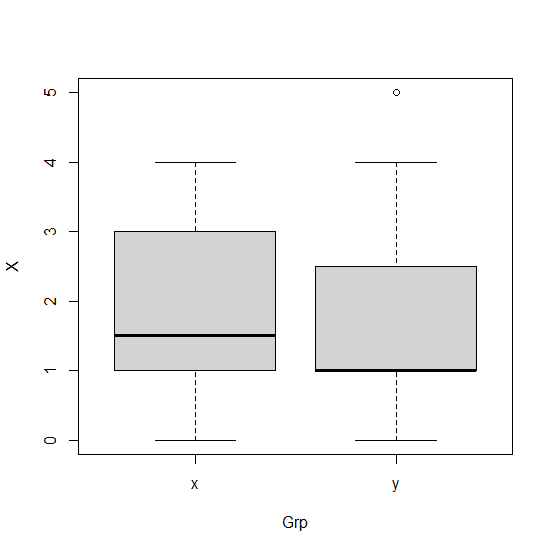
Creating the boxplot for groups in df −
> boxplot(X~Grp,data=df)
Output

Updated on: 2026-03-11T22:50:56+05:30
2K+ Views

Advertisements