
Article Categories
- All Categories
-
 Data Structure
-
 Networking
-
 RDBMS
RDBMS
-
 Operating System
-
 Java
Java
-
 MS Excel
-
 iOS
iOS
-
 HTML
HTML
-
 CSS
CSS
-
 Android
-
 Python
-
 C Programming
-
 C++
C++
-
 C#
C#
-
 MongoDB
-
 MySQL
MySQL
-
 Javascript
-
 PHP
PHP
-
 Economics & Finance
How to create a circle with different color border in R?
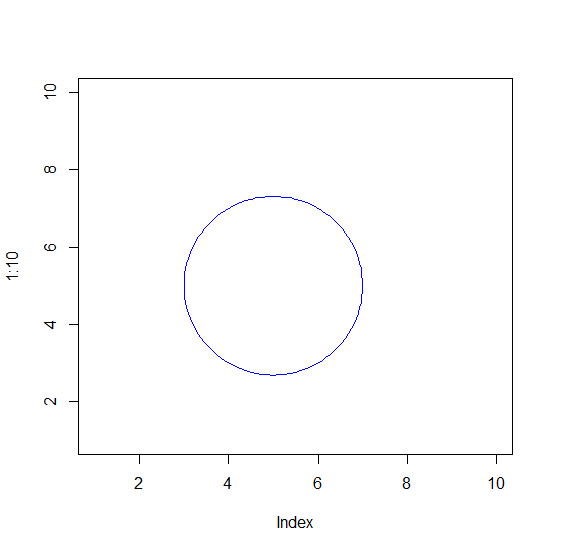
We can create a circle in R by using draw.circle function of plotrix package and default border color of the circle is black. If we want to change the border color of a circle then we can use border argument and pass the desired colors.
For Example, if we want to create a blue colored circle then, we can use the below mentioned command −
draw.circle(5,5,2,border="blue")
Check out the below Example to understand how it works.
Example
To create a colored circle add the following code to the above snippet −
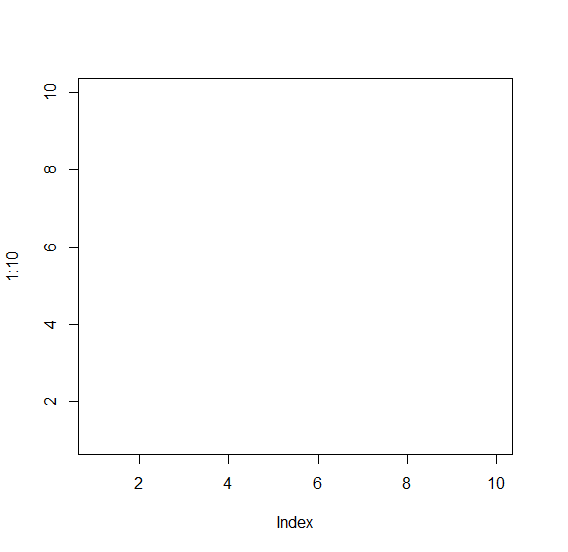
plot(1:10,type="n")
Output
If you execute the above given snippet, it generates the following Output −
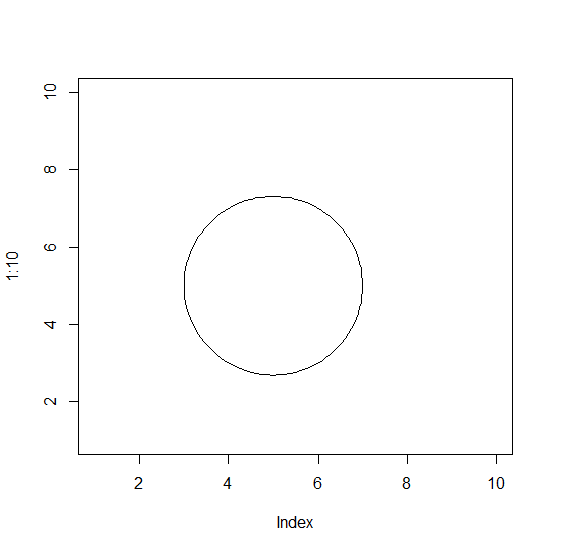
To create a colored circle add the following code to the above snippet −
plot(1:10,type="n")
library(plotrix)
draw.circle(5,5,2)
Output
If you execute all the above given snippets as a single program, it generates the following Output −
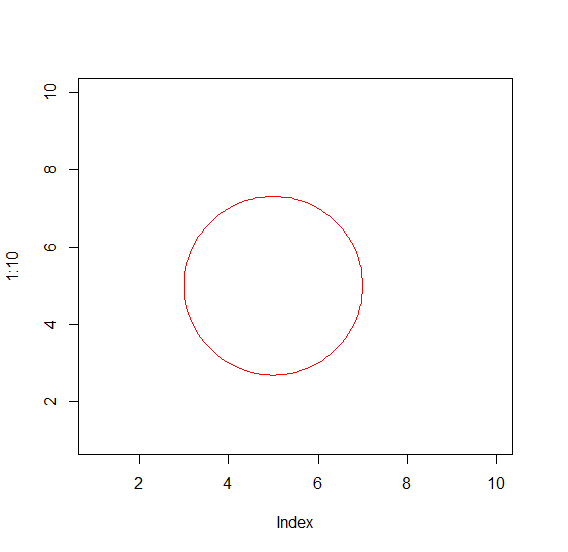
To create colored circle add the following code to the above snippet −
plot(1:10,type="n")
library(plotrix)
draw.circle(5,5,2,border="red")
Output
If you execute all the above given snippets as a single program, it generates the following Output −
To create colored circle add the following code to the above snippet −
plot(1:10,type="n")
library(plotrix)
draw.circle(5,5,2,border="blue")
Output
If you execute all the above given snippets as a single program, it generates the following Output −

576 Views
