
 Data Structure
 Networking
 RDBMS
RDBMS Operating System
 Java
Java MS Excel
 iOS
iOS HTML
HTML CSS
CSS Android
 Python
 C Programming
 C++
C++ C#
C# MongoDB
 MySQL
MySQL Javascript
 PHP
PHP
- Selected Reading
- UPSC IAS Exams Notes
- Developer's Best Practices
- Questions and Answers
- Effective Resume Writing
- HR Interview Questions
- Computer Glossary
- Who is Who
How to change the width of whisker lines in a boxplot using ggplot2 in R?
In R, by default the whisker lines are as wide as the box of the boxplot but it would be great if we reduce that width or increase it because it will get attention of the viewer in that way. This can be done by using the width argument inside the stat_boxplot function of ggplot2 package. Check out the below example to understand how it works.
Example
Consider the below data frame −
Example
> x<-sample(LETTERS[1:2],20,replace=TRUE)
> y<-rpois(20,5)
> df<-data.frame(x,y)
> df
Output
x y
1 B 5
2 B 4
3 A 6
4 A 9
5 B 2
6 B 4
7 B 6
8 B 2
9 B 4
10 B 8
11 B 3
12 A 7
13 B 5
14 A 7
15 A 2
16 B 7
17 B 7
18 A 2
19 B 5
20 B 5
Loading ggplot2 package and creating boxplot −
Example
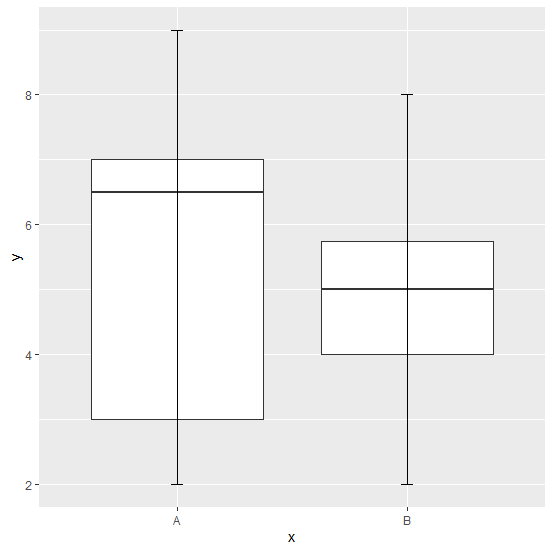
> library(ggplot2)
> ggplot(df,aes(x,y))+geom_boxplot()+stat_boxplot(geom="errorbar")
Output
Creating the boxplot with different whisker lines width −
Example
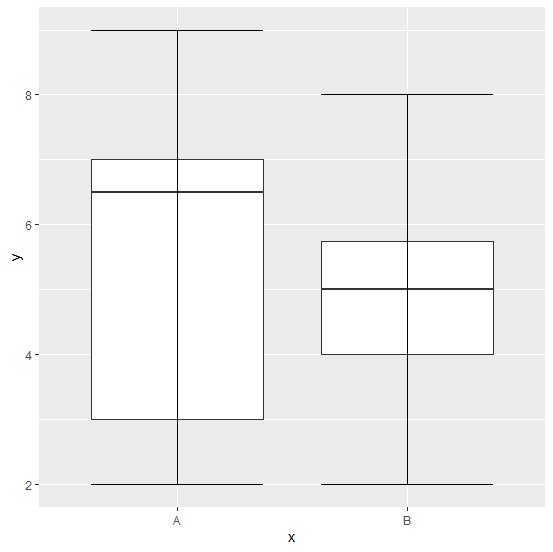
> ggplot(df,aes(x,y))+geom_boxplot()+stat_boxplot(geom="errorbar",width=0.05)
Output
Example
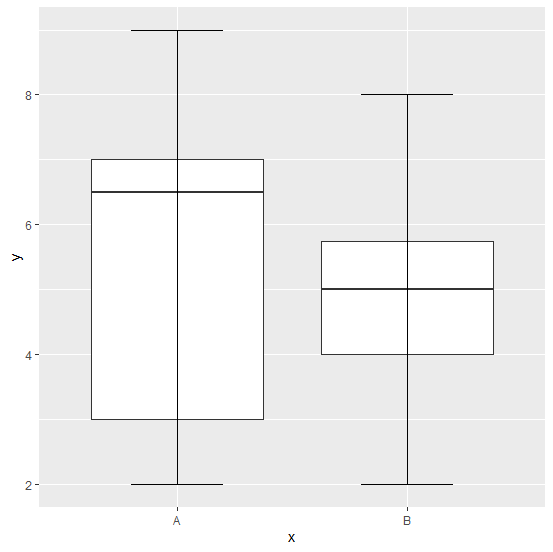
> ggplot(df,aes(x,y))+geom_boxplot()+stat_boxplot(geom="errorbar",width=0.40)
Output

Updated on: 2021-01-04T06:50:59+05:30
2K+ Views

Advertisements