
Article Categories
- All Categories
-
 Data Structure
-
 Networking
-
 RDBMS
RDBMS
-
 Operating System
-
 Java
Java
-
 MS Excel
-
 iOS
iOS
-
 HTML
HTML
-
 CSS
CSS
-
 Android
-
 Python
-
 C Programming
-
 C++
C++
-
 C#
C#
-
 MongoDB
-
 MySQL
MySQL
-
 Javascript
-
 PHP
PHP
-
 Economics & Finance
Selected Reading
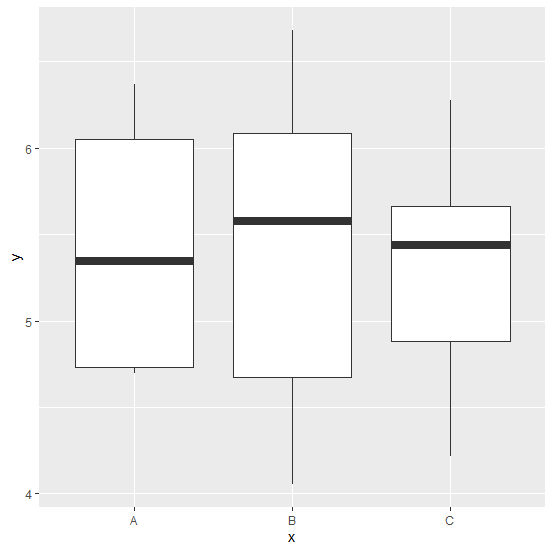
How to increase the width of the median line in boxplot using ggplot2 in R?
The default width of the median line is wider than the rest of the lines that represent minimum, first quartile, third quartile or maximum but we can make it a little wider to make it more appealing. This can be done with the help of fatten argument inside geom_boxplot function, the default value of fatten is 2.
Example
ggplot(df,aes(x,y))+geom_boxplot(fatten=6)
Output

Updated on: 2026-03-11T23:22:53+05:30
1K+ Views

Advertisements