
Article Categories
- All Categories
-
 Data Structure
-
 Networking
-
 RDBMS
RDBMS
-
 Operating System
-
 Java
Java
-
 MS Excel
-
 iOS
iOS
-
 HTML
HTML
-
 CSS
CSS
-
 Android
-
 Python
-
 C Programming
-
 C++
C++
-
 C#
C#
-
 MongoDB
-
 MySQL
MySQL
-
 Javascript
-
 PHP
PHP
-
 Economics & Finance
Selected Reading
How to increase the width of the lines in the boxplot created by using ggplot2 in R?
When we create a boxplot using ggplot2, the default width of the lines in the boxplot is very thin and we might want to increase that width to make the visibility of the edges of the boxplot clearer. This will help viewers to understand the edges of the boxplot in just a single shot. We can do this by using lwd argument of geom_boxplot function of ggplto2 package.
Example
Consider the below data frame −
> ID<-rep(c("S1","S2","S3","S4"),times=100)
> Count<-sample(1:50,400,replace=TRUE)
> df<-data.frame(ID,Count)
> head(df,20)
Output
 ID Count
1 S1 20
2 S2 14
3 S3 17
4 S4 30
5 S1 17
6 S2 23
7 S3 36
8 S4 10
9 S1 14
10 S2 28
11 S3 42
12 S4 10
13 S1 25
14 S2 12
15 S3 4
16 S4 38
17 S1 3
18 S2 45
19 S3 33
20 S4 43
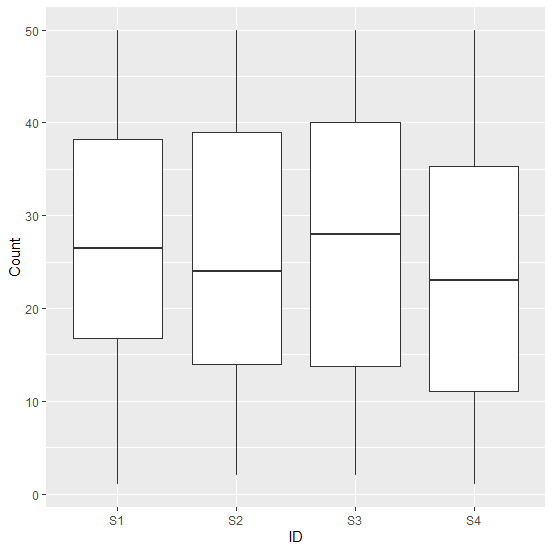
Loading ggplot2 package and creating boxplot of Count for IDs −
> library(ggplot2)
> ggplot(df,aes(ID,Count))+geom_boxplot()
Output
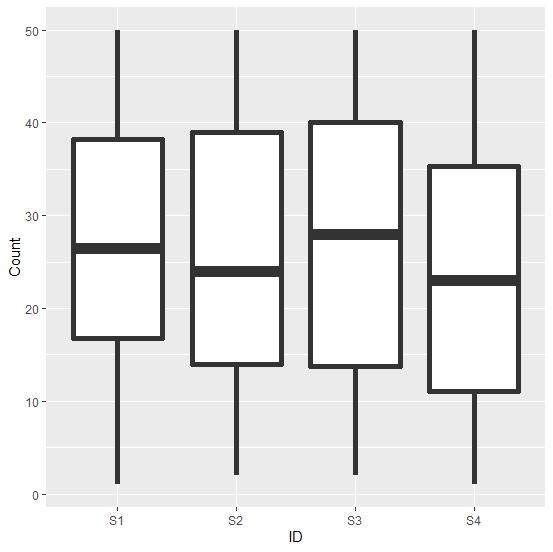
Creating the boxplot with different width of the lines −
> ggplot(df,aes(ID,Count))+geom_boxplot(lwd=2)
Output

Updated on: 2026-03-11T22:50:51+05:30
3K+ Views

Advertisements