
Article Categories
- All Categories
-
 Data Structure
-
 Networking
-
 RDBMS
RDBMS
-
 Operating System
-
 Java
Java
-
 MS Excel
-
 iOS
iOS
-
 HTML
HTML
-
 CSS
CSS
-
 Android
-
 Python
-
 C Programming
-
 C++
C++
-
 C#
C#
-
 MongoDB
-
 MySQL
MySQL
-
 Javascript
-
 PHP
PHP
-
 Economics & Finance
How to Add a Series to a Chart in Excel?
In this tutorial, we will show how you can add an additional series to an existing chart without recreating the chart. This can save you a lot of time and also help you understand the outcome if any new data is added. Using a small trick, we can add a new series to a chart in Excel.
Adding a Series to a Chart in Excel
Let us suppose we have the following data available in an Excel sheet. To start with, we will convert this available data to a chart.
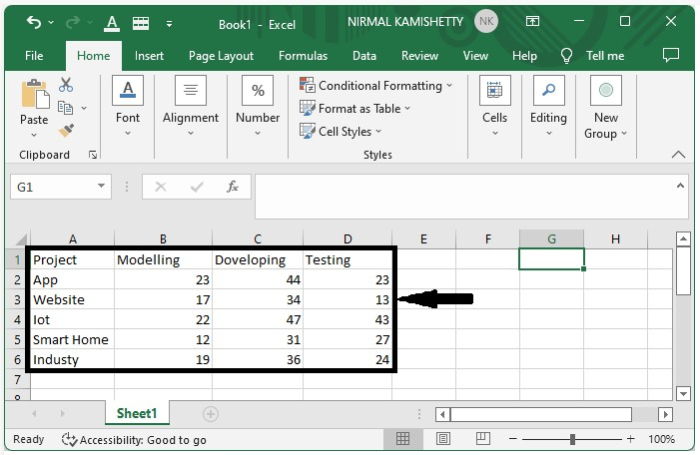
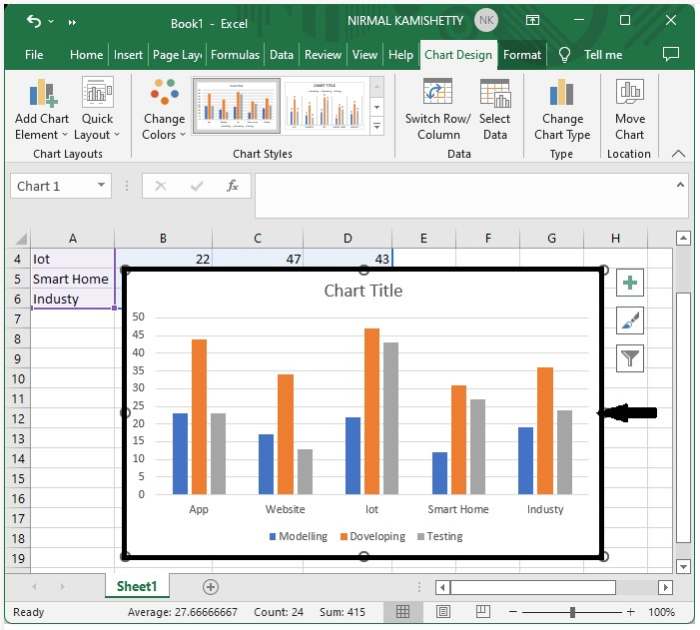
Step 1:
To create the chart, select the data ? click Insert ? select 2D Column Chart. The chart for the above data will look like the one shown below:
Step 2:
To add a new series, enter the new series in the table ? right-click on the chart ? Select Data Source. It will open a new pop-up window, as shown in the following image:
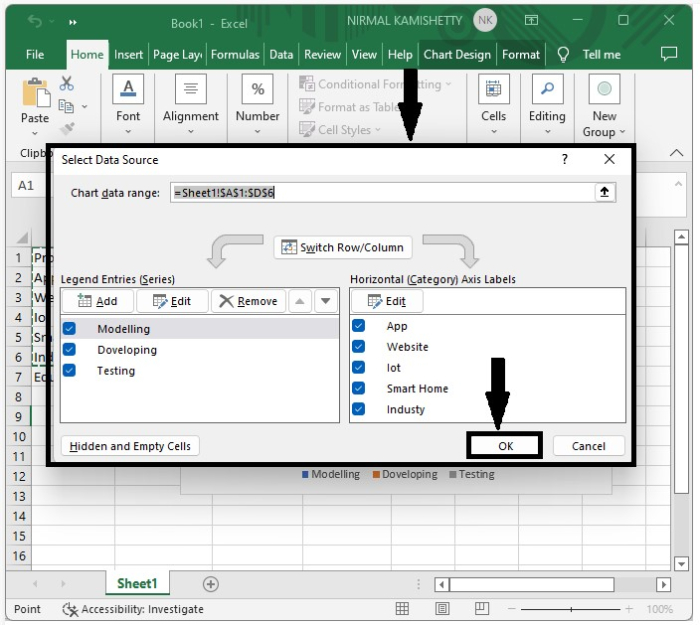
Step 3:
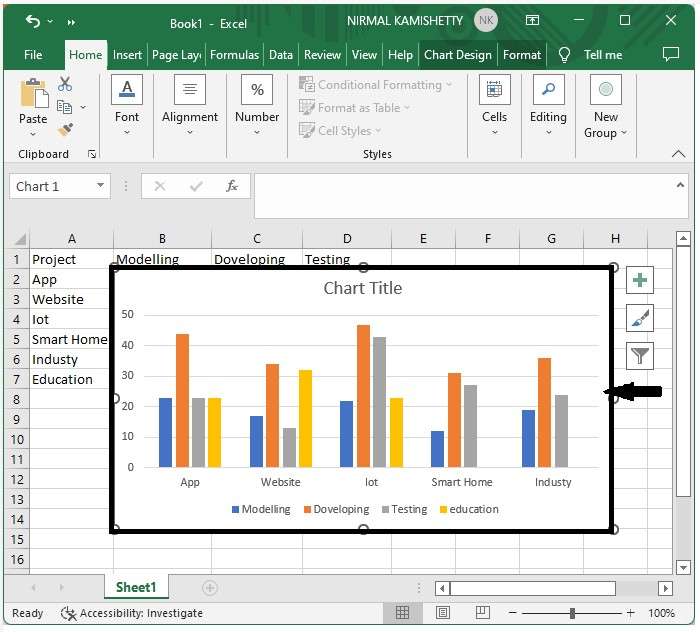
In the new pop-up window, click "OK". It will open another pop-up window on which you need to enter the Series Name as "Education" and the Series Value as Address of all the values of New Series. Click "OK" to close the pop-up window.
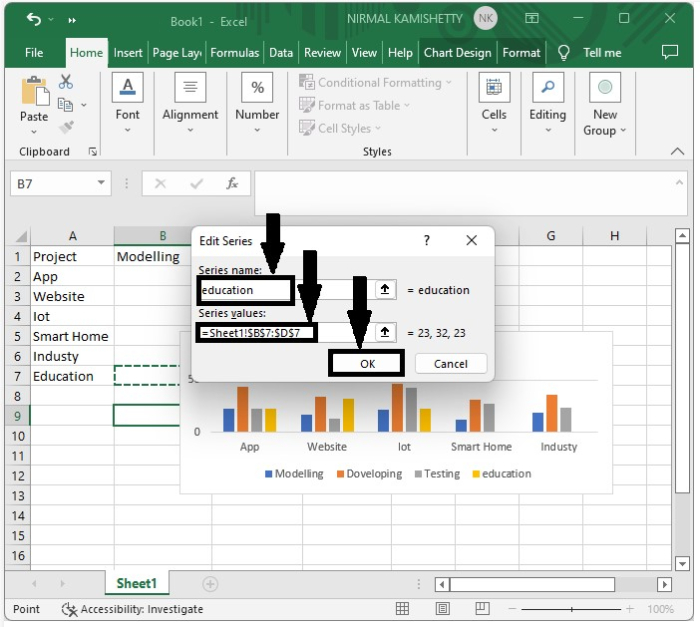
Again click the "OK" button to close the pop-up window. Now, you can observe the new series is added to the existing chart, as shown below:
Conclusion
In this tutorial, we used an example to demonstrate how you can add a new series to an already existing chart in Excel.

3K+ Views
