 Data Structure
 Networking
 RDBMS
RDBMS Operating System
 Java
Java MS Excel
 iOS
iOS HTML
HTML CSS
CSS Android
 Python
 C Programming
 C++
C++ C#
C# MongoDB
 MySQL
MySQL Javascript
 PHP
PHP
- Selected Reading
- UPSC IAS Exams Notes
- Developer's Best Practices
- Questions and Answers
- Effective Resume Writing
- HR Interview Questions
- Computer Glossary
- Who is Who
How to add multiple graphs to a Plotly Dash app on a single browser page in Python Plotly?
Plotly is an open-source plotting library in Python that can generate several different types of charts. Python users can use Plotly to create interactive web-based visualizations that can be displayed in Jupyter notebooks, saved to standalone HTML files, or served as a part of web applications using Dash. Plotly can also be used in static document publishing and desktop editors such as PyCharm and Spyder.
Dash is a Python framework and it is used to create interactive web-based dashboard applications. The dash library adds all the required libraries to web based dashboard applications.
In this tutorial, we will show how you can add multiple graphs to a Plotly Dash app on a single browser page. Follow the steps given below to generate multiple Dash apps on a single page.
Step 1
Import the Dash library.
import dash
Step 2
Import the Dash core components, dcc and html.
from dash import dcc,html
Step 3
Import the following Dash dependencies.
from dash.dependencies import Input, Output
Step 4
Import the plotly.express module and alias as px.
import plotly.express as px
Step 5
Generate a dataset using the Pandas module
import pandas as pd
df_bar = pd.DataFrame({
   "Season": ["Summer", "Winter", "Autumn", "Spring"],
   "Rating": [3,2,1,4]
})
Step 6
Generate a bar chart using the following values and store it inside the "fig" variable.
fig = px.bar(df_bar, x="Season", y="Rating", barmode="group")
Step 7
Create the main function to run the App server using the following command ?
app = dash.Dash(__name__)
if __name__ == '__main__':
   app.run_server(debug=True)
Step 8
Generate the App layout for two different HTML children in two "div" sections.
app.layout = html.Div(children=[
   # elements from the top of the page
   html.Div([html.H1(children='Dash app1'),
   html.Div(children='''Dash: First graph.'''),
   dcc.Graph(id='graph1',figure=fig),]),

   # New Div for all elements in the new 'row' of the page
   html.Div([
      html.H1(children='Dash app2'),
      html.Div(children='''Dash: Second graph.'''),
      dcc.Graph(id='graph2',figure=fig),
   ]),
])
Example
Here is the complete code to create multiple graphs on a single web page in Dash ?
import dash
from dash import dcc,html
from dash.dependencies import Input, Output

import pandas as pd
import plotly.express as px
app = dash.Dash(__name__)
df_bar = pd.DataFrame({
   "Season": ["Summer", "Winter", "Autumn", "Spring"],
   "Rating": [3,2,1,4]
})

fig = px.bar(df_bar, x="Season", y="Rating", barmode="group")
app.layout = html.Div(children=[
   # elements from the top of the page
   html.Div([
      html.H1(children='Dash app1'),
      html.Div(children='''
      Dash: First graph.'''),

      dcc.Graph(
         id='graph1',
         figure=fig
      ),
   ]),
   # New Div for all elements in the new 'row' of the page
   html.Div([
      html.H1(children='Dash app2'),
      html.Div(children='''
      Dash: Second graph. '''),

      dcc.Graph(
         id='graph2',
         figure=fig
      ),
   ]),
])

if __name__ == '__main__':
app.run_server(debug=True)
Output
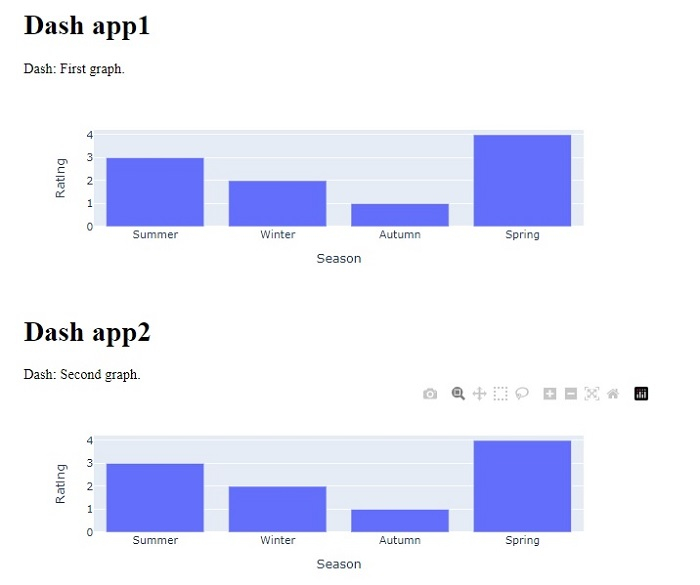
When you execute the above program, you will get the following output on the console ?
Dash is running on http://127.0.0.1:8050/
* Serving Flask app 'main'
* Debug mode: on
Upon clicking the URL, you will be redirected to the browser which will show the following output ?


