 Data Structure
 Networking
 RDBMS
RDBMS Operating System
 Java
Java MS Excel
 iOS
iOS HTML
HTML CSS
CSS Android
 Python
 C Programming
 C++
C++ C#
C# MongoDB
 MySQL
MySQL Javascript
 PHP
PHP
- Selected Reading
- UPSC IAS Exams Notes
- Developer's Best Practices
- Questions and Answers
- Effective Resume Writing
- HR Interview Questions
- Computer Glossary
- Who is Who
How to manually add a legend color and legend font size on a plotly figure in Python?
This tutorial will explain how to manually add the legend text size and color on a Plotly figure using Python. By the end of this tutorial, you will be able to create interactive graphs and charts with the help of the potent Python data visualization package, Plotly. Plot development must include a legend that aids viewers in comprehending the information. However, not all situations will be accommodated by Plotly's default legend settings. This article will discuss how to manually apply legend colors and font sizes to a Plotly figure in Python.
Syntax
Plotly's update_layout() method and the legend_font_color and legend_font_size parameters can be used to manually add a legend color and font size. An illustration of syntax is provided below ?
fig = px.scatter(df, x="x", y="y", size=None, color=None, hover_name=None, title='My title')

# Set legend color
fig.update_layout(legend_font_color=None)

# Set font size
fig.update_layout(legend_font_size=None)
The given code creates a scatter plot using the Plotly Express library with the x and y data from a pandas DataFrame 'df'. The scatter plot has no size or color information, and no hover information is displayed. The plot title is set to 'My title'.
The 'fig' object created by the px.scatter() function is then updated using the fig.update_layout() method to modify the plot layout. The legend_font_color parameter is set to None. Similarly, the legend_font_size parameter is set to None.
Example
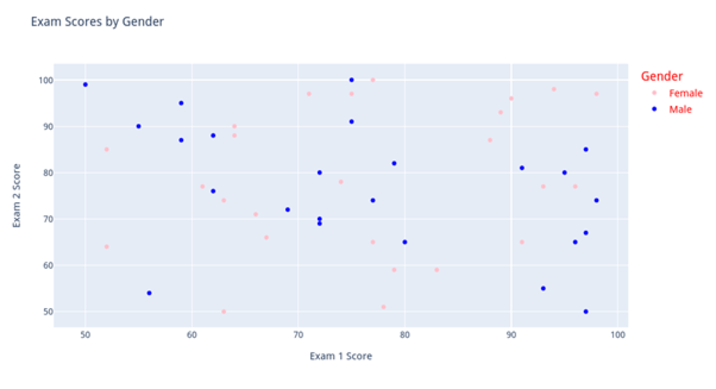
In this example, we created our own dataframe by defining a data dictionary containing three keys: 'Exam 1 Score', 'Exam 2 Score', and 'Gender'. Random integer and string values are assigned to these keys using NumPy. We then used the pd.DataFrame() method to create a DataFrame from the data dictionary.
The px.scatter() method is then used to create the scatter plot. The 'Exam 1 Score' and 'Exam 2 Score' columns from the DataFrame are used as the x and y axes, respectively. The 'Gender' column is used to color-code the markers in the plot using the color parameter. A color_discrete_map dictionary is used to map the 'Male' and 'Female' values in the 'Gender' column to blue and pink colors, respectively. Then we set the title of the plot to 'Exam Scores by Gender'.
Finally, the fig.update_layout() method is used to customize the plot's legend. The legend_font_color parameter is set to '=red' to change the color of the legend text, and the legend_font_size parameter is set to 14 to increase the font size of the legend text.
The plot is then displayed using the fig.show() method.
import plotly.express as px
import pandas as pd
import numpy as np

# create a sample dataset
data = {'Exam 1 Score': np.random.randint(50, 101, 50),
        'Exam 2 Score': np.random.randint(50, 101, 50),
        'Gender': np.random.choice(['Male', 'Female'], 50)}
df = pd.DataFrame(data)

# create a scatter plot with colored markers
fig = px.scatter(df, x='Exam 1 Score', y='Exam 2 Score', color='Gender', color_discrete_map={'Male': 'blue', 'Female': 'pink'}, title='Exam Scores by Gender')

# Set legend color to black
fig.update_layout(legend_font_color='red')

# Set legend font size to 14
fig.update_layout(legend_font_size=14)

# display the plot
fig.show()
Output

Example
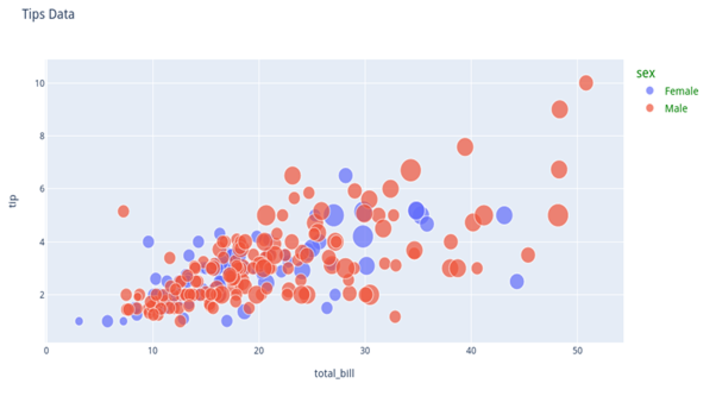
In this example, we start by using the px.data.tips() function to first load the tips dataset into a Pandas DataFrame. This enables us to work with the data and produce visualizations using the data provided in the dataset.
To create the scatter plot, the px.scatter() function from Plotly Express is used, and the "total_bill" and "tip" columns from the dataset are specified as the x and y axes of the plot. The "size" column is specified as the size of the markers, and the "color" column is specified as the variable to use for coloring the markers based on the sex of the person paying the bill. The title of the plot is set to "Tips Data".
After creating the plot, the update_layout() method is used to customize the plot layout. In particular, the legend_font_color parameter is set to 'green', and the legend_font_size parameter is set to 14. These parameters control the color and font size of the legend that appears on the plot.
Finally, the plot is displayed using the show() function from Plotly. The resulting plot displays the relationship between the total bill and tip amount for customers at a restaurant, with markers sized by another variable and colored by the sex of the person paying the bill. The legend font color is set to green, and the font size is set to 14 for improved readability.
import plotly.express as px

# load tips dataset
df = px.data.tips()

# create a scatter plot with size-scaled markers
fig = px.scatter(df, x='total_bill', y='tip', size='size', color='sex', title='Tips Data')

# customize plot layout
fig.update_layout(legend_font_color='green', legend_font_size=14)

# display the plot
fig.show()
Output

Conclusion
As a result, we have learned how to manually add a legend color and legend font size to a plotly figure in Python. Including a tale in a Plotly graphic is an essential component of data visualization. If the default settings are insufficient in some circumstances, it might be necessary to manually adjust the legend color and text size. The update_layout() method can be used to set the legend_font_color and legend_font_size arguments. By following the examples provided in this tutorial, users can modify their Plotly plots to satisfy their own needs and improve the clarity of their visualizations.

