 Data Structure
 Networking
 RDBMS
RDBMS Operating System
 Java
Java MS Excel
 iOS
iOS HTML
HTML CSS
CSS Android
 Python
 C Programming
 C++
C++ C#
C# MongoDB
 MySQL
MySQL Javascript
 PHP
PHP
- Selected Reading
- UPSC IAS Exams Notes
- Developer's Best Practices
- Questions and Answers
- Effective Resume Writing
- HR Interview Questions
- Computer Glossary
- Who is Who
How to change the size of a Dash Graph in Python Plotly?
Plotly supports two different libraries "Plotly graphs in a Dash app" and "Plotly Graph objects in Plotly Express". Dash is a Python framework and it is used to create interactive web-based dashboard applications. The dash library adds all the required libraries to web-based dashboard applications
Import dash core components and html components. Add plotly.express method to generate graphs. Use the Dcc.Graph() method to set the style for height and width coordinates.
In this tutorial, we will show how you can add multiple graphs to a Plotly Dash app on a single browser page. Follow the steps given below to generate Dash app on a single page.
Step 1
Import the Dash library.
import dash
Step 2
Import the Dash core components, dcc and html
from dash import dcc, html
Step 3
Import the dash dependencies using the below module ?
from dash.dependencies import Input, Output
Step 4
Import the plotly.express module and alias as px
import plotly.express as px
Step 5
Generate dataset using the Pandas module. Let us generate the dataset using the following method,
# import pandas module
import pandas as pd

df_bar = pd.DataFrame({
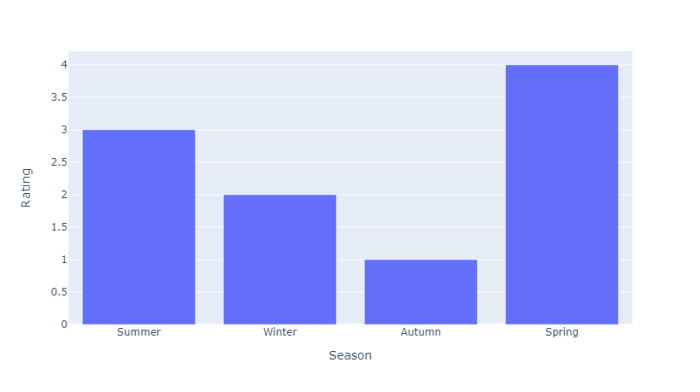
   "Season": ["Summer", "Winter", "Autumn", "Spring"],
   "Rating": [3,2,1,4]
})
Step 6
Generate the bar chart using the following coordinates and store it inside the fig variable.
fig = px.bar(df_bar, x="Season", y="Rating", barmode="group")
Step 7
Create the main function to run the app server using the below command,
app = dash.Dash(__name__)
if __name__ == '__main__':
   app.run_server(debug=True)
Step 8
Generate the app layout for html children in div sections. It is defined below,
app.layout = html.Div(children=[

   # elements from the top of the page
   html.Div([html.H1(children='Dash app1'),
   html.Div(children='''Dash: First graph.'''),
   dcc.Graph(id='graph1',figure=fig),]),

   # New Div for all elements in the new 'row' of the page
   html.Div([
      html.H1(children='Dash app2'),
      html.Div(children='''Dash: Second graph.'''),
      dcc.Graph(id='graph2', figure=fig),
   ]),
])
Example
Here is the complete code to change the size of a Dash Graph in Plotly ?
import dash
from dash import dcc, html
import pandas as pd
import plotly.express as px

app = dash.Dash(__name__)
df_bar = pd.DataFrame({
   "Season": ["Summer", "Winter", "Autumn", "Spring"],
   "Rating": [3, 2, 1, 4]
})

fig = px.bar(df_bar, x="Season", y="Rating", barmode="group")

# app layout for html div and set height and width
app.layout = html.Div(children=[

   # All elements from the top of the page
   html.Div([
      html.H1(children='Dash app1'),
      html.Div(children='''
         Dash: First graph.
      '''),

      dcc.Graph(
         id='graph1',
         figure=fig,
         style={'width': '60vw', 'height': '70vh'}
      ),
   ])
])

if __name__ == '__main__':
   app.run_server(debug=True)
Output
It will show the following output on the console.
Dash is running on http://127.0.0.1:8050/
 * Serving Flask app 'main'
 * Debug mode: on
Click the URL and it will display the following output on the browser ?

Observe how we have used the "style" property in "dcc.Graph()" to change the size of the Dash graph.

