 Data Structure
 Networking
 RDBMS
RDBMS Operating System
 Java
Java MS Excel
 iOS
iOS HTML
HTML CSS
CSS Android
 Python
 C Programming
 C++
C++ C#
C# MongoDB
 MySQL
MySQL Javascript
 PHP
PHP
- Selected Reading
- UPSC IAS Exams Notes
- Developer's Best Practices
- Questions and Answers
- Effective Resume Writing
- HR Interview Questions
- Computer Glossary
- Who is Who
Plot Live Graphs using Python Dash and Plotly
Python provides powerful tools like Dash and Plotly for creating interactive and dynamic visualizations using which we can create live graphs so that we can visualize data in real-time which is essential for gaining valuable insights. This article explores how to plot live graphs using Python Dash and Plotly.
We'll learn how to set up a Dash application, define the layout, and update the graph dynamically using callbacks. By leveraging Plotly's rich visualization capabilities and Dash's flexibility, we can create real-time graphs that respond to changing data. Whether it's monitoring sensor data, tracking financial trends, or visualizing live analytics, Python Dash and Plotly offer an efficient solution for interactive graphing.
How to plot live graphs using Python Dash and Plotly?
Below are the steps that we will follow to plot live graphs using Python Dash and Plotly ?
-
Import the necessary modules ?
`dash` and `plotly.graph_objs` are imported from the `dash` and `plotly` packages.
`dcc` and `html` are imported from the `dash` package for creating components.
`Output`, `Input`, and `Interval` are imported from the `dash.dependencies` module for defining callbacks and updating components.
-
Initialize the Dash app:
Create an instance of the `Dash` class and assign it to the `app` variable.
-
Define the layout of the app:
Use the `html.Div` component to create a container for the app's content.
Inside the `Div`, add an `html.H2` component to display the title "Live Graph".
Add a `dcc.Graph` component with an `id` of "live-graph" to display the graph. Set `animate` to `True` to enable live updates.
Include a `dcc.Interval` component with an `id` of "graph-update" to define the interval at which the graph will update.
-
Define the callback function:
Use the `@app.callback` decorator to specify the function that will update the graph.
The callback function takes the `n_intervals` property of the `graph-update` component as input. This property represents the number of times the interval has elapsed.
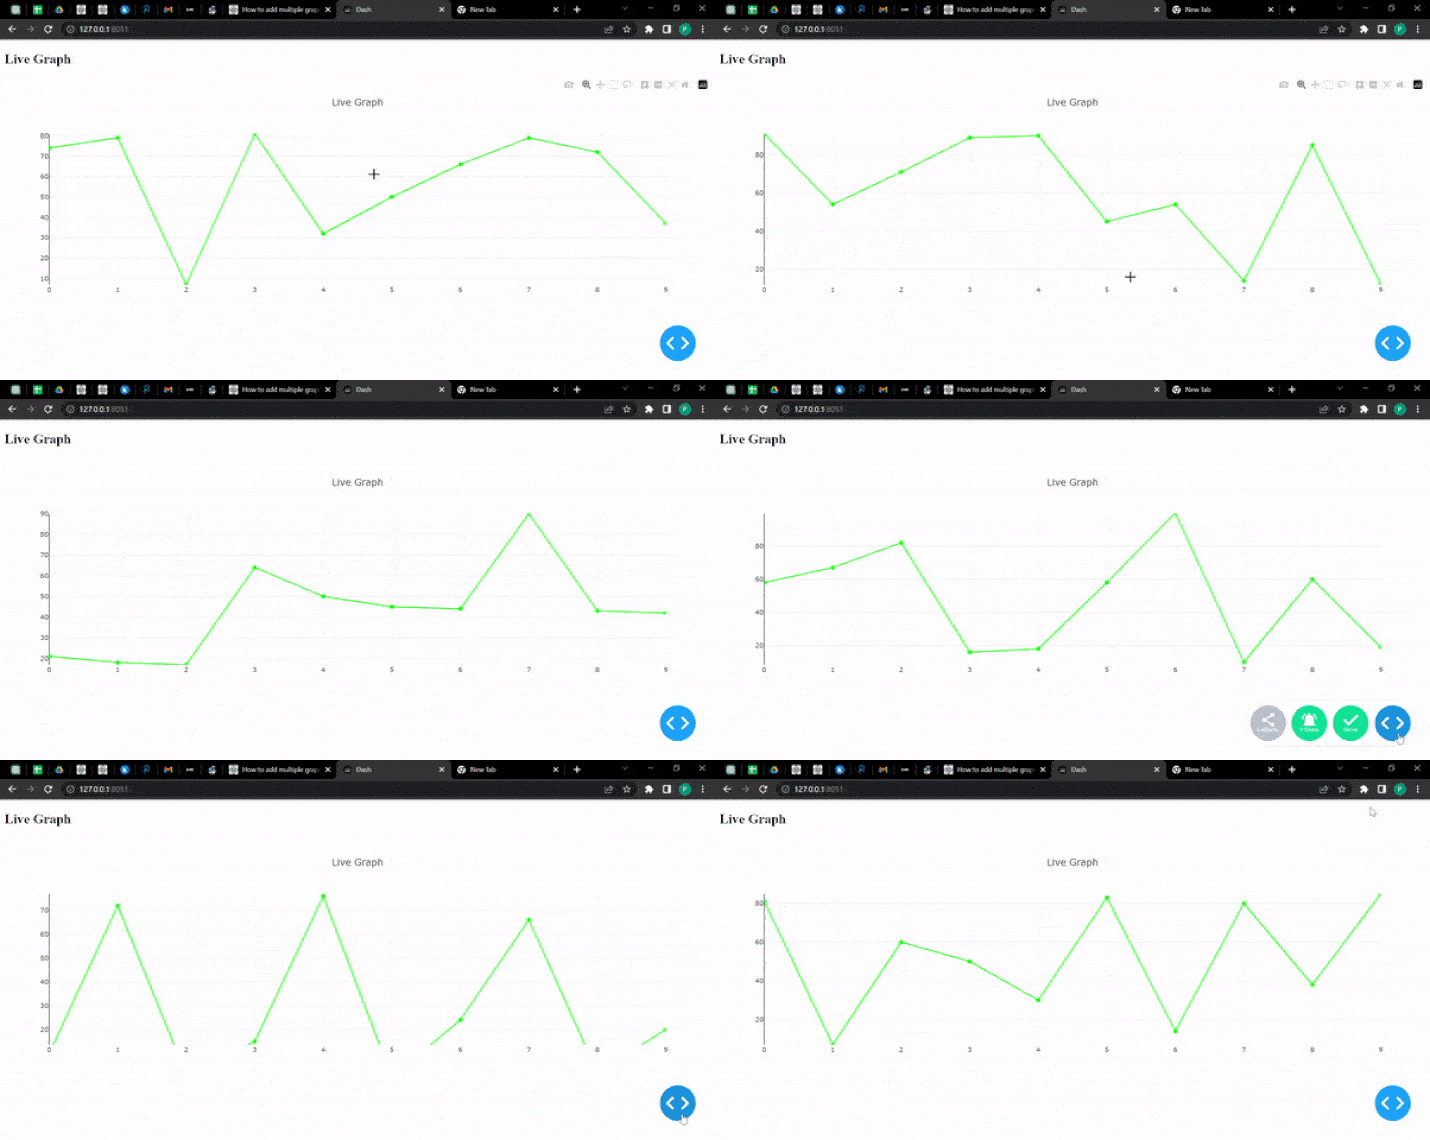
Inside the function, generate random data for the x-axis and y-axis values. In the below program example, the x-axis ranges from 0 to 9, and the y-axis values are randomly generated integers between 0 and 100.
Create a `go.Scatter` object to represent the graph trace. Customize its appearance using the provided parameters.
Create a `go.Layout` object to define the layout of the graph. Here, we set the title and specify the ranges for the x-axis and y-axis based on the generated data.
Return a dictionary with the `data` and `layout` components, representing the graph figure to be displayed.
-
Run the app:
Use the `if __name__ == "__main__":` block to ensure that the app is only run when the script is executed directly (not imported as a module).
Within the block, call the `run_server` method of the `app` instance to start the Dash server. Set `debug` to `True` for debugging purposes, and specify the `port` number to run the server on. Here, it is set to 8051.
By following these steps, we can plot live graphs using Dash and Plotly. We can customize the graph data, appearance, and layout based on your requirements. Remember to install the necessary dependencies (`dash` and `plotly`) using
pip install dash plotly
Before running the program.
Example
import dash
from dash import dcc, html
from dash.dependencies import Output, Input
import plotly.graph_objs as go
import random

# Initialize the Dash app
app = dash.Dash(__name__)

# Define the layout of the app
app.layout = html.Div(
   [
      html.H2("Live Graph"),
      dcc.Graph(id="live-graph", animate=True),
      dcc.Interval(id="graph-update", interval=1000, n_intervals=0),
   ]
)

# Callback function to update the graph
@app.callback(Output("live-graph", "figure"), [Input("graph-update", "n_intervals")])
def update_graph(n):
   # Generate random data
   x_data = list(range(10))
   y_data = [random.randint(0, 100) for _ in range(10)]

   # Create the graph trace
   trace = go.Scatter(
      x=x_data,
      y=y_data,
      mode="lines+markers",
      name="Data",
      line={"color": "rgb(0, 255, 0)"},
      marker={"color": "rgb(0, 255, 0)", "size": 8},
   )

   # Create the graph layout
   layout = go.Layout(
      title="Live Graph",
      xaxis=dict(range=[min(x_data), max(x_data)]),
      yaxis=dict(range=[min(y_data), max(y_data)]),
   )

   # Return the graph figure
   return {"data": [trace], "layout": layout}

if __name__ == "__main__":
   app.run_server(debug=True, port=8051)
Output
C:\Users\Tutorialspoint>python image.py
Dash is running on http://127.0.0.1:8051/

 * Serving Flask app 'image'
 * Debug mode: on

Conclusion
In conclusion, Python Dash and Plotly provides a powerful combination for creating live graphs that dynamically visualize data. By following the steps outlined in this article, we can easily set up a Dash application, define the layout, and update the graph in real time.
With the ability to customize the appearance and behavior of the graphs, Python Dash and Plotly empower data analysts and developers to create interactive and insightful visualizations that adapt to changing data. Whether it's for monitoring, analysis, or reporting, this approach offers a versatile solution for plotting live graphs in Python.

