 Data Structure
 Networking
 RDBMS
RDBMS Operating System
 Java
Java MS Excel
 iOS
iOS HTML
HTML CSS
CSS Android
 Python
 C Programming
 C++
C++ C#
C# MongoDB
 MySQL
MySQL Javascript
 PHP
PHP
- Selected Reading
- UPSC IAS Exams Notes
- Developer's Best Practices
- Questions and Answers
- Effective Resume Writing
- HR Interview Questions
- Computer Glossary
- Who is Who
Creating a Web-based Data Visualization Dashboard with Python and Plotly Dash
Data visualization allows us to explore patterns, trends, and relationships within our data, enabling us to derive meaningful insights. In this tutorial, we will explore how to create a web?based data visualization dashboard using Python and Plotly Dash.
What is Plotly Dash?
Python, being a popular programming language for data analysis and visualization, offers various libraries and frameworks to create interactive visualizations. One such powerful framework is Plotly Dash.
Plotly Dash is a Python framework that allows you to build interactive web applications and dashboards with ease. It combines the simplicity and versatility of Python with the flexibility and interactivity of modern web technologies like HTML, CSS, and JavaScript.
With Plotly Dash, you can create custom dashboards that provide real?time updates, interactive visualizations, and seamless integration with data sources. The key advantage of Plotly Dash is its declarative syntax, which makes it easy to define the layout and components of your dashboard.
You can use Python code to describe the structure and appearance of your dashboard, without the need to write HTML or JavaScript. This makes the development process faster and more accessible to Python developers.
Additionally, Plotly Dash offers a wide range of interactive components, such as graphs, sliders, dropdowns, and tables, that can be easily integrated into your dashboard. These components enable users to interact with the data, filter and explore different aspects, and gain deeper insights.
Plotly Dash also supports real?time updates, allowing your dashboard to respond dynamically to changes in the underlying data.
Getting Started
Before we begin, let's ensure that we have the necessary tools and libraries installed. We will be using Plotly Dash, which can be installed via pip, the standard package manager for Python. Open your terminal or command prompt and execute the following command:
pip install dash
Once the installation is complete, we can start building our web?based data visualization dashboard.
Web?based Data Visualization Dashboard with Plotty Dash
To create a web?based data visualization dashboard with Plotly Dash, we need to follow a few key steps. First, let's import the necessary modules and classes:
import dash
import dash_core_components as dcc
import dash_html_components as html
from dash.dependencies import Input, Output
Next, we can initialize the Dash application:
app = dash.Dash(__name__)
Now, let's define the layout of our dashboard. In Dash, the layout is defined using HTML components and Dash?specific components. We can use the html module to define the overall structure of the dashboard, and the dcc module to add interactive components.
app.layout = html.Div(
    children=[
        html.H1("Data Visualization Dashboard"),
        dcc.Graph(id="graph"),
        dcc.Slider(
            id="slider",
            min=0,
            max=10,
            step=0.5,
            value=5,
            marks={i: str(i) for i in range(11)},
        ),
    ]
)
In this code, we have a simple layout consisting of an H1 heading, a graph component, and a slider component. The graph component will display our data visualization, and the slider component will allow users to interact with the data.
Now, let's define the callback functions that will update the graph based on user interactions. We can use the @app.callback decorator to specify the inputs and outputs of the function.
@app.callback(
    Output("graph", "figure"),
    [Input("slider", "value")]
)
def update_graph(value):
    # Code to update the graph based on the slider value
    # Replace with your own data and visualization code
    # Return the updated graph figure
    pass
In the update_graph function, you can replace the placeholder code with your own data processing and visualization code. The function takes the value of the slider as input and should return the updated graph figure.
Finally, we can run the Dash application:
if __name__ == "__main__":
    app.run_server(debug=True)
This will start the web server and make the dashboard available in your browser. You can access it by navigating to the specified local address.
Example
Here is the complete code:
import dash
import dash_core_components as dcc
import dash_html_components as html
from dash.dependencies import Input, Output

app = dash.Dash(__name__)

app.layout = html.Div(
    children=[
        html.H1("Data Visualization Dashboard"),
        dcc.Graph(id="graph"),
        dcc.Slider(
            id="slider",
            min=0,
            max=10,
            step=0.5,
            value=5,
            marks={i: str(i) for i in range(11)},
        ),
    ]
)

@app.callback(
    Output("graph", "figure"),
    [Input("slider", "value")]
)
def update_graph(value):
    # Placeholder code to update the graph based on the slider value
    # Replace with your own data and visualization code
    import plotly.express as px
    import pandas as pd

    # Generate sample data
    df = pd.DataFrame({"x": [1, 2, 3, 4, 5], "y": [value * i for i in range(1, 6)]})

    # Create a scatter plot
    fig = px.scatter(df, x="x", y="y", title="Scatter Plot")

    return fig

if __name__ == "__main__":
    app.run_server(debug=True)
Sample Output
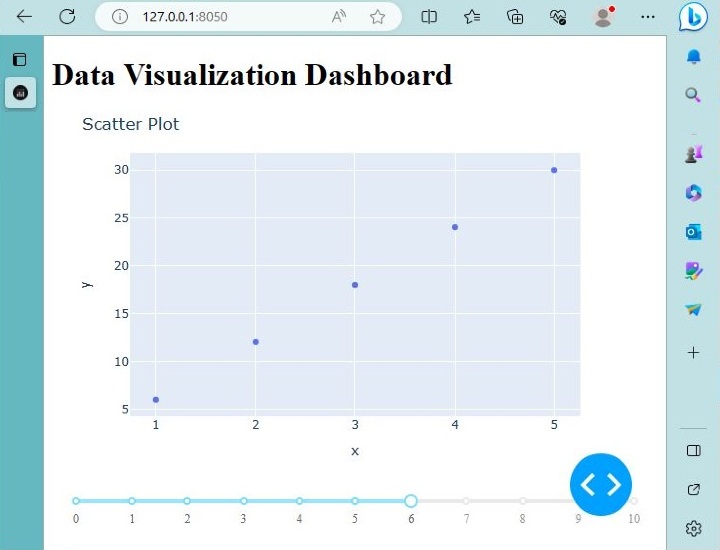
After running the above code, you will see a web?based dashboard with a heading, a scatter plot, and a slider. Moving the slider will update the graph based on the selected value.

In this example, we have a scatter plot where the y-values are multiplied by the slider value.
Conclusion
In this tutorial, we learned how to create a web?based data visualization dashboard using Python and Plotly Dash. Plotly Dash provides a simple and flexible framework for building interactive dashboards that can be deployed on the web. We covered the installation of Plotly Dash using pip and explored the main components and steps involved in building a dashboard.

