 Data Structure
 Networking
 RDBMS
RDBMS Operating System
 Java
Java MS Excel
 iOS
iOS HTML
HTML CSS
CSS Android
 Python
 C Programming
 C++
C++ C#
C# MongoDB
 MySQL
MySQL Javascript
 PHP
PHP
- Selected Reading
- UPSC IAS Exams Notes
- Developer's Best Practices
- Questions and Answers
- Effective Resume Writing
- HR Interview Questions
- Computer Glossary
- Who is Who
How to plot multiple figures as subplots in Python Plotly?
Plotly is an open-source Python library for creating charts. You can use the features available in Plotly to set multiple figures as subplots.
In this tutorial, we will use plotly.graph_objects to generate the figures. It contains a lot of methods to customize chart and render a chart into HTML format. For example, plotly.subplots() method can be used to add subplots.
Follow the steps given below to create subplots with Plotly express.
Step 1
Import plotly.graphs_objs module and alias as go.
import plotly.graphs_objs as go
Step 2
Import make_subplots to create subplots.
from plotly.subplots import make_subplots
Step 3
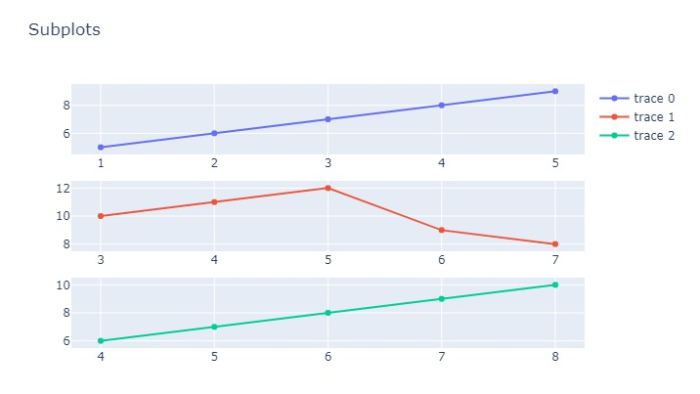
Create subplots for 3 rows and 1 column.
fig = make_subplots(rows=3, cols=1)
Step 4
Create the append_trace() method to append the Scatter plots.
fig.append_trace(go.Scatter(
   x=[1,2,3,4,5],
   y=[5,6,7,8,9],
), row=1, col=1)

fig.append_trace(go.Scatter(
   x=[3,4,5,6,7],
   y=[10,11,12,9,8],
), row=2, col=1)

fig.append_trace(go.Scatter(
   x=[4,5,6,7,8],
   y=[6,7,8,9,10]
), row=3, col=1)
Step 5
Use the update_layout() method to set the layout size.
fig.update_layout(height=400, width=400, title_text="Subplots")
Example
Here is the complete code to plot multiple figures as subplots ?
from plotly.subplots import make_subplots
import plotly.graph_objects as go

fig = make_subplots(rows=3, cols=1)

fig.append_trace(go.Scatter(
   x=[1,2,3,4,5],
   y=[5,6,7,8,9],
), row=1, col=1)

fig.append_trace(go.Scatter(
   x=[3,4,5,6,7],
   y=[10,11,12,9,8],
), row=2, col=1)

fig.append_trace(go.Scatter(
   x=[4,5,6,7,8],
   y=[6,7,8,9,10]
), row=3, col=1)

fig.update_layout(height=450, width=716, title_text="Subplots")
fig.show()
Output
It will show the following output on the browser ?


