 Data Structure
 Networking
 RDBMS
RDBMS Operating System
 Java
Java MS Excel
 iOS
iOS HTML
HTML CSS
CSS Android
 Python
 C Programming
 C++
C++ C#
C# MongoDB
 MySQL
MySQL Javascript
 PHP
PHP
- Selected Reading
- UPSC IAS Exams Notes
- Developer's Best Practices
- Questions and Answers
- Effective Resume Writing
- HR Interview Questions
- Computer Glossary
- Who is Who
How to Create a Population Pyramid Using Plotly in Python?
A population pyramid is a graphical representation of the age and gender distribution of a population. It consists of two back?to?back bar charts, one showing the distribution of males and the other showing the distribution of females across different age groups. The population pyramid is a powerful visualisation tool that can help us understand the demographic composition of a population and identify trends and patterns.
In this article, we will explore how to create a population pyramid using Plotly in Python. Plotly is a powerful visualisation library that allows us to create interactive and dynamic plots in Python.
We will use Plotly to create a population pyramid that shows the age and gender distribution of a population. We will start by loading the data into a pandas DataFrame and then use Plotly to create the population pyramid.
Using Plotly Express
Plotly Express is a high?level API for Plotly that makes it easy to create many types of plots, including population pyramids. We can use the px.bar() function to create the two back?to?back bar charts that make up the population pyramid.
Consider the code shown below.
Example
import plotly.express as px
import pandas as pd

# Load the data into a pandas DataFrame
df = pd.read_csv("population_data.csv")

# Create the population pyramid using Plotly Express
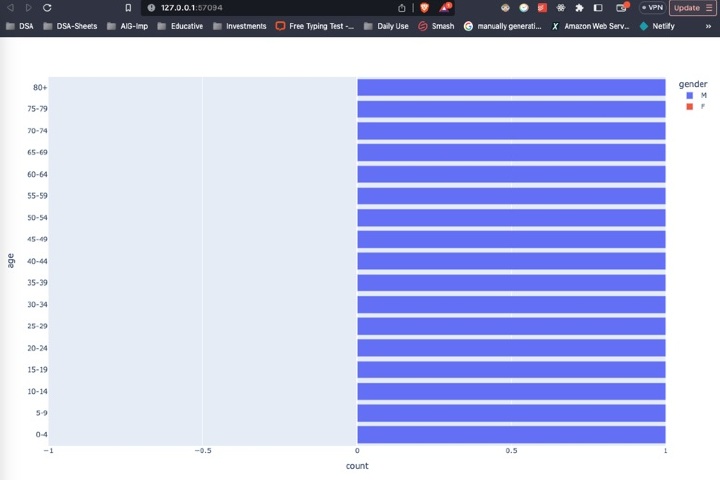
fig = px.bar(df, x="count", y="age", orientation="h", color="gender",
         	barmode="relative", range_x=[-1, 1])

# Show the plot
fig.show()
Explanation
We start by importing the libraries, including plotly.express for creating the plot and pandas for loading the data into a DataFrame.
Next, we load the population data from a CSV file into a pandas DataFrame using the read_csv() function.
We then create the px.bar() function, which takes the DataFrame as the first argument and several other arguments to specify the plot layout and styling.
The x argument specifies the variable to use for the bar length, which is the count of people in each age group.
The y argument specifies the variable to use for the bar height, which is the age group.
The orientation argument specifies that the bars should be horizontal.
The colour argument specifies that the bars should be coloured by gender.
The barmode argument specifies that the bars should be stacked relative to each other.
The range_x argument specifies the range of the x?axis, which determines the size of the pyramid.
Finally, we print the plot using the show() method.
Output

Using Plotly Graph Objects
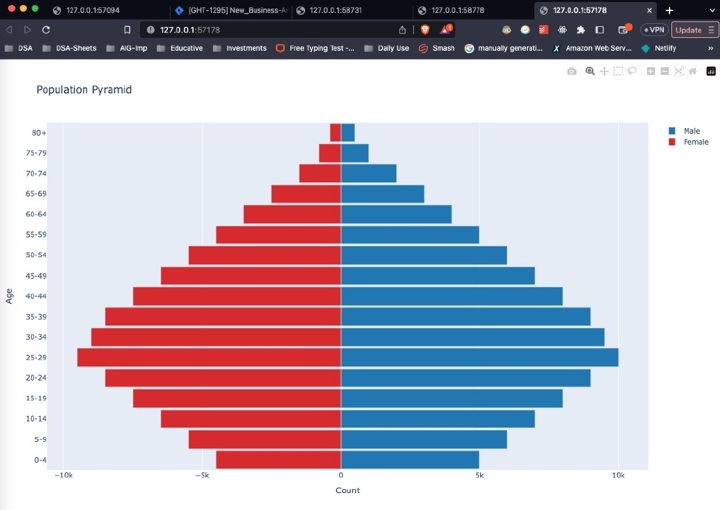
Plotly Graph Objects is a lower?level API for Plotly that provides more flexibility and control over the plot layout and styling. We can use Plotly Graph Objects to create a population pyramid by creating two bar traces, one for males and the other for females, and then combining them into a single figure.
Consider the code shown below.
Example
import plotly.graph_objs as go
import pandas as pd

# Load the data into a pandas DataFrame
df = pd.read_csv("population_data.csv")

# Create the male and female bar traces
trace_male = go.Bar(x=df[df["gender"]=="M"]["count"],
                	y=df[df["gender"]=="M"]["age"],
                	orientation="h",
                	name="Male",
                	marker=dict(color="#1f77b4"))

trace_female = go.Bar(x=df[df["gender"]=="F"]["count"]*(-1),
                  	y=df[df["gender"]=="F"]["age"],
                  	orientation="h",
                  	name="Female",
                  	marker=dict(color="#d62728"))

# Create the layout
layout = go.Layout(title="Population Pyramid",
               	xaxis=dict(title="Count"),
               	yaxis=dict(title="Age"),
               	barmode="overlay",
               	bargap=0.1)

# Create the figure
fig = go.Figure(data=[trace_male, trace_female], layout=layout)

# Show the plot
fig.show()
Explanation
The first step is to import the necessary modules: plotly.graph_objs and pandas.
The data is loaded into a pandas DataFrame using the pd.read_csv method.
Two bar chart traces are created for male and female populations using go.Bar method with respective x and y values for counts and age groups. The orientation is set to horizontal and each trace is given a name and colour using name and marker arguments.
A layout is created for the plot with a title and labels for the x and y axes.
A figure is created using the go.Figure method with the two traces and layout.
Finally, the plot is displayed using the fig.show() method.
Output

Conclusion
In this article, we learned how to create a population pyramid using Plotly in Python. We explored two different approaches to achieve this, one using a pandas pivot table and another using Plotly graph objects. We discussed the advantages and disadvantages of each approach and provided a detailed explanation of the code used in each method.
By following the steps and examples provided in this article, you can create their own population pyramids using Plotly in Python and explore various ways to customise and analyse their data.

